Angus and Rosemary's Miscellany
of Malvern - Other Resources
|
Coronavirus (COVID-19) epidemic final weekly update for Malvern SeniorsClick to read our observations on politics and world events 2nd April 2023
Prevalence remains high so don't be too surprised if you or one of your friends catches a mild dose. Note: New Court Surgery at Prospect View will be holding a Spring Booster clinic for those aged 75+ years on Saturday 15th April - you may already have received an invitation by text message or phone. Boosters might also be available from Claremont House Pharmacy in Barnards Green and Evans in Malvern Link; check NHS website for availability. See also - getting a booster dose of the COVID-19 vaccine PreambleFor three years we have been keeping an eye on the published government figures and monitoring the media to asses the likely level of risk for Seniors in the Malvern Hills district and providing links to where further information could be found. During March 2023, government reporting of COVID-19 figures was cutback, so it is time to bring our weekly posts to an end. This is the final weekly post, but there could yet be occasional updates if circumstances change. Those still wishing to monitor the figures will find a summary on the Coronavirus Dashboard which continues to be updated weekly at 4 pm on Thursdays. Fortnightly Independent SAGE updates remain another source of figures. If you are familiar with Excel spreadsheets, NHS England hospital admissions, beds, and deaths reported by ONS are a measure of the tail of the COVID-19 pandemic in the UK. ContentsSummaryThe incidence of COVID-19 remains quite high and, despite some week to week variation, there has been little sign of cases dropping sharply. Last week, hospital bed occupancy in England fell, but only by 5%. By early April, the COVID death rate in England and Wales may increase from 575 towards 700 deaths per week, which is nothing to be alarmed about as few deaths are in Worcestershire. These are 'baked in' deaths - relating to people already infected and it will take ONS 2 to 3 weeks to gather the data. Vaccination, and natural immunity following infection, continue to protect most of the population from severe illness and death and people are now going about their business as if COVID never happened. Spring Boosters for those aged 75+ wishing to top up their immunity should become available at GP surgeries in April 2023. If you catch COVID for a second or perhaps even a third time it is likely to be a mild illness, though you might feel quite poorly and be left feeling very tired. (Definitions: mild = treatable at home; severe = treated in hospital). This will be our last weekly update as, being in the tail of the epidemic, little is changing week to week. However we may post occasional updates should the numbers change significantly. Take Care What happens if you get sick with COVIDIf you are feeling poorly it might not be COVID-19 but some other respiratory illness; there seem to be plenty doing the rounds. Whatever the virus best stay at home until you feel better, and wear a face mask to protect others if you do have to go out. Nowadays, you probably won't know it's COVID and brush it off as just another cold. Despite vaccination, some of those who have caught COVID report either getting easily tired or suffering from shortness of breath for some weeks afterwards; if so patients are advised to take it easy until fully recovered as there seems to be no 'one size fits all' treatment. A small number of patients (less than 10%) report debilitating symptoms for months after so-called recovery especially middle aged women. For example see Dez Medinger and Danny Altmann's book The Long COVID Handbook in bibliography. PrecautionsVaccination SitesInformation about the Spring Booster Campaign is awaited. It is anticipated jabs will become available in GP surgeries for those aged 75 years and over, and the clinically vulnerable, in April 2023.
|
| Date report published | Prevalence (England) | Ratio of people with COVID |
| 3rd March 2023 | 1,298,600 | 1:45 |
| 10th March 2023 | 1,333,400 | 1:40 |
| 16th March 2023 | 1,322,000 | 1:40 |
| 24th March 2023 | 1,493,200 | 1:38 |
| Paused | Paused | Paused |
Prevalence of COVID-19 in England estimated by ONS
Zoe Health Study
The ZOE Health Study estimates are shown in the following table.
| Date of screenshot | Prevalence (UK) | Estimated new infections per day |
| 16th February 2023 | 1,206,030 | 99,032 |
| 23rd February 2023 | 1,277,787 | 92,168 |
| 2nd March 2023 | 1,271,693 | 88,670 |
| 10th March 2023 | 1,221,821 | 81,851 |
| 17th March 2023 | 1,334,080 | 127,914 |
| 23rd March 2023 | 1,404,346 | 111,241 |
| 30th March 2023 | 1,499,083 | 105,172 |
Prevalence of COVID-19 in UK estimated by the Zoe Health Study
According to the latest Zoe figures, estimated prevalence has risen by 6% while daily cases fell by 5% in the last 6 days; it appears cases may be beginning to dip.
The fall in daily cases correlates with a small reduction in Hospital bed occupancy.
 Number
of deaths
Number
of deaths
Statistics on COVID deaths are published by Public Health England, The Office of National Statistics, and NHS England. These can't be directly compared as they cover different periods, but together the figures paint a picture of the direction of travel - which is that the COVID-19 death rate (by date of death) has been rising a little, though not to a level to be concerned about.
Note: basically there has been a small rise in the death rate during March after which the death rate may halve during the Spring and Summer.
PHE figures
The Dashboard chart of COVID (28) deaths, following a positive test, by date of death shows that the 7 day average peaked in England at 167 deaths per day around 30th December; marking the peak of the Winter Wave.
By this measure deaths are already trending downwards from 120 towards 110 deaths per day.
Click to view the UK government Coronavirus Dashboard
The PHE figures include people who die with COVID but not from it so are likely to be higher than the ONS numbers.
ONS figures
The Office of National Statistics (ONS) reports registered deaths in England and Wales where COVID-19 is mentioned somewhere on the death certificate. The ONS figures lag real time by 10 - 14 days due to the administrative delay in submitting and processing reports, and do not include Northern Ireland and Scotland.
Note: the figures include cases where COVID may have been a secondary cause of death.
Click for ONS data on deaths (Excel spreadsheet)
ONS figures for Worcestershire by date reported
The ONS figures can be filtered by Local Authority providing a glimpse of where deaths are occurring. The provisional cumulative total of COVID related deaths in Worcestershire reported by the ONS up to 17th March (week 11 of 2023) is shown in the table below.
Note: these numbers are derived from Table 1 of the ONS Death Registrations spreadsheet using the in-built filters. This gives the provisional total of deaths registered in any week, which can be distorted by delayed reporting, for example, due to public holidays.
Deaths by Welsh Health Boards are excluded to avoid duplication as these are totals of Local authorities.
| Districts of Worcs |
Deaths 2020 |
Deaths 2021 |
Deaths 2022 |
Deaths 2023 |
Week 11 | Population |
| Bromsgrove | 164 | 142 | 59 | 11 | 0 | 98,529 |
| Malvern Hills | 61 | 98 | 74 | 10 | 1 | 77,545 |
| Redditch | 108 | 109 | 47 | 10 | 0 | 85,317 |
| Worcester | 87 | 134 | 51 | 6 | 0 | 103,542 |
| Wychavon | 157 | 154 | 85 | 17 | 2 | 126,240 |
| Wyre Forest | 171 | 132 | 62 | 8 | 0 | 100,957 |
| TOTAL | 748 | 769 | 378 | 62 | 3 | 592,130 |
Provisional cumulative COVID-19 deaths in Worcestershire registered by ONS to 17th March 2023.
There was 1 death in a care home in the Malvern Hills; and 2 deaths in hospital in Wychavon.
The general picture continues to be of a 'handful' of weekly deaths in Worcestershire.
ONS figures for England and Wales by date reported
In England and Wales 559 COVID-19 related deaths were reported in the week to 17th March, 27 more than the week before and a rise of about 5%. Of these 90 were in care homes, 32 at home, 13 in a hospice, 421 in hospital and 3 elsewhere.
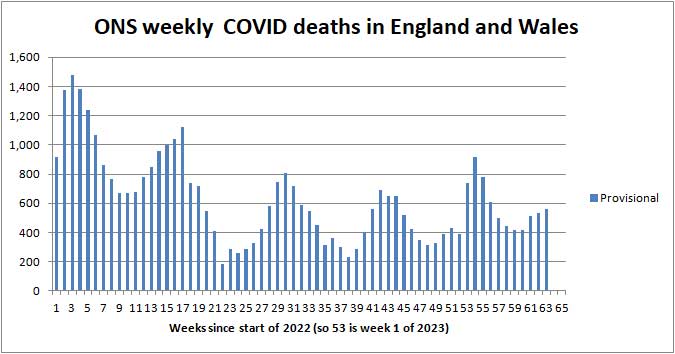
ONS provisional deaths 'by week reported' in England and Wales since the start of 2022 (so week 53 is week 1 of 2023)
The cumulative total of 2023 COVID deaths registered by ONS in England and Wales to 17th March is 6,394.
ONS figures for England and Wales by date of death
Table 2 of the ONS spreadsheet gives England and Wales figures by date of death. This is a more accurate metric but it takes an additional two to three weeks for most of the registrations to flow in; see extract in the table below.
| Week of 2023 | Number of deaths reported last week |
Number of deaths reported this week |
| 1 | 813 | 816 |
| 2 | 691 | 694 |
| 3 | 573 | 575 |
| 4 | 451 | 453 |
| 5 | 425 | 428 |
| 6 | 400 | 401 |
| 7 | 409 | 410 |
| 8 | 447 | 452 |
| 9 | 474 | 490 |
| 10 | 405 | 549 (incomplete) |
| 11 | - | 407 (incomplete) |
ONS weekly COVID deaths in England and Wales - 'by date of death'
The peak of the Winter Wave appears to have settled at about 816 deaths per week.
Of the 559 deaths reported in week 11, only 407 deaths were in that week. The latter figure will rise as reports of deaths in that week continue to flow in. Once the total this week is close to the total the previous week, the number 'by date of death' can be considered fairly stable.
Deaths in week 10 look like ending up about 575.
Comparison with deaths from 'All causes'
ONS registered 12,110 deaths from All causes in week 11 in England and Wales so currently COVID-19 deaths are about 4.6% of all deaths.
Many of these are said to be of the elderly who die a few months earlier than they might otherwise do. COVID is perhaps an extra burden which pushes the very frail over the edge.
Note: Deaths registered from All causes in week 11 are significantly higher than 11,389 in week 10, This may be real, but could be due to varying delays in reporting, or a mixture of both.
Averaged over recent years roughly 1,700 people die daily from all causes in the UK.
Deduct about 10% for Scotland and Northern Ireland
Deaths are usually higher in the winter and lower in the summer.
NHS England figures for deaths
This is said to be the last update from the NHS England website.
NHS England figures for Worcestershire
The table below shows COVID deaths in Worcestershire hospitals reported by NHS England on 30th March 2023.
| Worcestershire | Cumulative deaths | Past week |
| Acute hospitals | 1,281 | +4 |
| Care hospitals | 99 | +0 |
| TOTAL | 1,380 | +4 |
Excludes deaths in care homes, deaths at home and deaths in hospices.
Note: the increase is the difference between this week's cumulative total and that last reported.
Click for NHS COVID-19 total announced deaths
Look for COVID Total announced deaths file, then select tab Deaths by Trust.
Risk of COVID-19 death by age band
NHS England provides an analysis of COVID-19 deaths in hospital in England and Wales by age band. Shown below is a snapshot of 2,898 deaths for the period 6th May 2022 to 6th July 2022 when most of these deaths will have been from the Omicron variants.
| Age band | Number of COVID deaths | % of deaths |
| 0 - 19 | 8 | 0.3 |
| 20 - 39 | 25 | 0.9 |
| 40 - 59 | 165 | 5.7 |
| 60 - 79 | 1,010 | 34.9 |
| 80+ | 1,692 | 58.4 |
Relative risk of COVID-19 death by age band May - July 2022
The main point to note is those aged 60+ account for 93% of deaths despite young people being more likely to catch COVID-19.
The risk profile for Omicron appears to be the same as for Delta. Age is still the greatest risk factor; perhaps reflecting that older people have more health problems.
According to the Coronavirus Dashboard sex is an additional risk factor - males are roughly 50% more likely to die than women; possibly because women have a stronger immune system.
 Healthcare numbers
The UK government Coronavirus Dashboard includes information about healthcare statistics and NHS bed occupancy.
| Hospital COVID cases (England) | Number | Last week |
| Patients currently in hospital | 7,963 | -424 |
| Patients on ventilation | 192 | +20 |
| Patients admitted daily | 901 | -92 |
Headline summary of patients in hospital reported on 30th March 2023
The figures suggest new daily cases have peaked and are beginning to fall.
Note: 'Patients admitted daily' is the weekly total divided by 7. This number includes both patients admitted to hospital with COVID-19 from the community, and those diagnosed with COVID-19 in hospital.
Also see charts on the Coronavirus Dashboard and below.
Daily hospital admissions in England
This chart of daily COVID hospital admissions and diagnoses also suggests the increase since the middle of January 2023 has peaked.
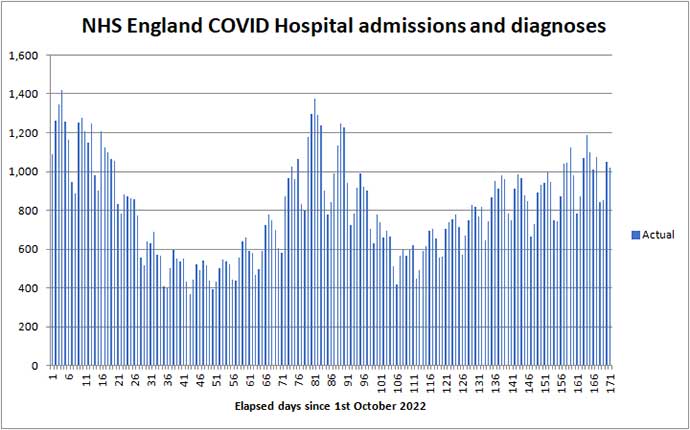
Daily admissions from 1st October to 26th March 2023
Bed numbers by region in England
Tabulated figures for COVID bed occupancy in England can be found on the NHS England website providing another indicator of the prevalence of COVID.
Click for NHS England COVID-19 Hospital bed Activity statistics
Note: see the latest Daily Admissions and Beds spreadsheets, then look for all COVID beds.
| Region | 23rd March 2023 | 30th March 2023 | 15th January 2021 |
| England | 8,387 | 7,963 | 33,362 |
| London | 1,370 | 1,309 | 7,811 |
| Midlands | 1,692 | 1,415 | 5,890 |
Comparison of All beds COVID data for England, London and Midlands
In the last week the number of COVID-19 General and Acute beds fell by 5% in England, 4% in London, and 16% in the Midlands.
For comparison, the number of beds occupied during the peak of the epidemic in January 2021 is shown in red in the right hand column of the table.
The chart below shows how COVID bed occupancy fell slightly in the last week.
Note: the peak in beds is seems to be roughly one week delayed on the peak in daily admissions, and deaths lag beds by a further week.
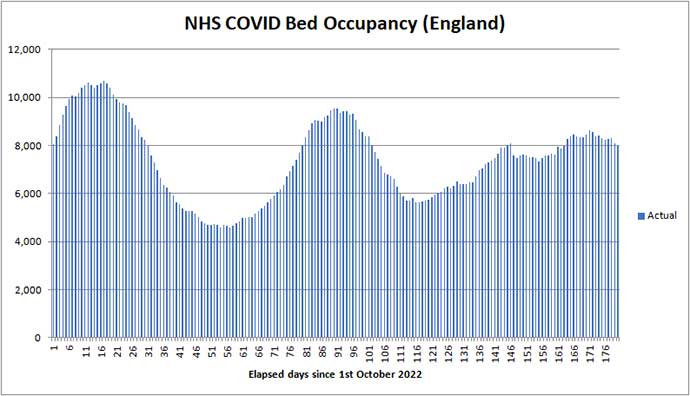
COVID bed occupancy in England from 1st October to 29th March 2023
It's clear from the above chart COVID shows no sign of going away any day soon.
Worcestershire
hospital beds
Between 21 March 2023 and 27 March 2023, 66 patients went into hospital with coronavirus. This shows an increase of 32% compared to the previous 7 days. There were 88 patients in hospital with coronavirus on 29 March 2023, eight more than the week before; two on a ventilator.
Click for Summary of Malvern numbers on the Coronavirus dashboard
Contrary to the national trend COVID bed numbers in Worcestershire, though small, are going up.
Forecast for the week ahead
COVID related weekly deaths registered in England and Wales could fall somewhere in the range 550 to 650 in week 12 of 2023 to be reported by the ONS on 4th April.
In the county of Worcestershire, based on 66 new hospital cases last week and assuming the ratio of all deaths (including those in care homes and at home) to be 1:11 of admissions, then one might expect no more than 6 COVID deaths per week in the first half of April 2023.
NHS COVID bed occupancy in England is expected to fall slightly next week.
Longer term outlook
The weekly COVID ONS death rate (by date of death) in England and Wales peaked at about 816 deaths per week around 1st January 2023 roughly coinciding with a peak in hospital bed occupancy of 9,500.
After dipping, NHS hospital bed occupancy in England crept back up reaching a plateau of about 8,400 COVID beds.
If deaths are proportional, the ONS death rate could creep up towards 720 deaths per week by early April. These are 'baked in' deaths - relating to people already infected, which won't be reported by ONS until towards the end of April.
UCL modelling
The latest UCL projection of 25th March is that the 7-day average of daily (certified) deaths may peak at over 100 per day (700 per week) about 7th April 2023 and then fall to less than 50 per day for the remainder of the year.
Based upon present trends, that projection looks credible.
Click for UCL Long-term forecasting of the COVID-19 epidemic
Note: the UCL projection is usually updated every two weeks.
Advice for Seniors
We judge the risk of exposure to COVID-19 remains quite high in England, while there are many other seasonal respiratory viruses circulating that could make you feel just as sick.
There is no evidence that COVID is currently causing alarming numbers of people in Worcestershire to fall severely ill; so for most, the risk might perhaps now be considered LOW.
Consequently we have moved our riskometer to LOW (see opposite).
Many, perhaps most, healthy people continue to take the view that COVID is no longer a critical threat to their health.
For the more cautious the simple safeguards to protect against all respiratory infections, are to:
-
make sure your vaccinations are up to date, noting booster jabs for 75+ expected in April 2023.
-
wash your HANDS thoroughly, using soap and hot water, for 20 seconds, including after handling deliveries to your home, to kill virus picked up from contaminated surfaces (see note 1);
-
ideally wear either a well fitting FACE covering, or better still an FFP2 (N95) face mask when in crowded settings for example when in shops, theatres, health-care settings, when using public transport, and travelling by air;
-
SPACE at least 2 metres from people you don't feel safe with (see note 2);
-
preferably socialise with friends and other households outdoors in the FRESH AIR else, if you are indoors, either ventilate by keeping windows open as far as is practicable or consider putting a HEPA air purifier in the room;
-
avoid crowded indoor settings and friends and colleagues with cold and flu like symptoms;
-
stay at home to protect others if you yourself feel unwell with cold or flu like symptoms;
-
respect others and give them space;
Notes:
1) Wash your hands thoroughly before touching your face to avoid transferring virus from contaminated surfaces to your mouth, eyes and nose. If outdoors, for example filling the car up with fuel, either wash hands with an alcohol based hand gel after touching suspect surfaces or wear gloves.
2) Two metres is further than you think - roughly an arm and a walking stick away.
3) If you are 'clinically vulnerable' consult your GP or specialist; you may need to take a test and consider anti viral drugs if testing positive.
Annex
Commentary
It feels like the time has come to bring our weekly COVID blog to an end. ONS has ceased measuring the prevalence of COVID-19 in the community. Prof Tim Spector of the Zoe app has ceased his weekly COVID briefings and even pundit Dr John Campbell has little to say these days. This week's report of COVID-19 deaths will be the last on the NHS England website, and the smartphone COVID tracker app is being switched off on 27th April 2023.
During the last few weeks there has been no great shift in the numbers. Possibly one person in a hundred is infectious, and as cases are remaining fairly constant that one person must be typically causing only one other person to become infected.
For most, life has returned to normal and COVID is a thing of the past. The hike in the price of gas, electricity and food is of more immediate concern.
People are still dying of COVID in the UK, mostly the elderly, but the baseline of 400 deaths per week, or thereabouts, is something the government and public seems prepared to tolerate and can do little about.
Spring booster vaccinations for those aged 75+ years are expected to become available in April 2023, from GP surgeries, for those that want them.
For those who wish to continue monitoring the numbers a summary is still being provided on the Coronavirus Dashboard which is updated once a week at 4 pm on Thursdays. Independent SAGE continues to provide fortnightly updates on YouTube at 1:30 pm on Fridays. Topics still under discussion include improving ventilation in buildings to slow the spread of all respiratory infections, for example in schools, and Long Covid for which there appear to be few treatments.
Independent SAGE
The next Independent SAGE fortnightly update is expected on 7th April 2023.
You can watch last week's briefing by clicking the link below.
Click to watch Independent SAGE update on 24th March 2023
List of vaccines
Section deleted. Refer to archived pages for historical information about vaccines.
Summary of Links
Some of this information is now out of date but provides a historical context to the epidemic.
Information about Coronavirus can be found on the NHS website:
https://www.nhs.uk/coronavirus
Symptoms
Note: the list of symptoms was updated on 1st April 2022
Article about the effects of Wuhan Coronavirus on the human body
Reporting and how to obtain a test
How to get a test
https://www.nhs.uk/coronavirus
About joining the Zoe COVID Symptom Study:
Guidance
UK government Coronavirus guidance
See also - government sets out next steps for living with COVID
COVID-19 Response: Autumn and Winter Plan 2021 for England
UK Health and Security Agency (UKHSA) website
COVID Alert states
Guidance on UK COVID-19 alert level methodology: an overview
COVID-19 Alert Level lowered to 3 on 10th May 2021
Tiers
Guidance on tiers: what you need to know
Government postcode checker to find tier for other areas
Statistics
UK government COVID-19: Omicron daily overview
UK government Coronavirus Dashboard
Coronavirus Dashboard Interactive Map
ONS data on deaths in England and Wales (Excel spreadsheet)
NHS England COVID-19 Daily Deaths
NHS England COVID-19 Hospital Admissions
NHS England vaccination statistics
Worcestershire Coronavirus Dashboard
Worcestershire COVID-19 Vaccinations Dashboard
HSA COVID-19 vaccine weekly surveillance reports
Information about NHS hospital bed numbers: past, present, future
A glimpse of the worldwide vaccination situation can be found on the Our World in Data website.
Click for chart showing % vaccinated
A video with Dr John Campbell and mathematician Professor Fenton explaining the various ways in which RISK can be specified.
Risks and benefits with Professor Fenton
Modelling
A forecast of the progression of the COVID-19 epidemic can be found on a University College London (UCL) website.
Click for UCL Long-term forecasting of the COVID-19 epidemic
A projection of the future COVID-19 death toll and daily deaths can be found on The Institute for Health Metrics and Evaluation website.
Click for IHME projection of COVID-19 deaths
Reports
Coronavirus (COVID-19) latest insights by ONS
A live roundup of the latest data and trends about the coronavirus (COVID-19) pandemic from the ONS and other sources.
MedRxiv is a US preprint server for Health Sciences. A depository for reports which have still to be peer reviewed.
COVID-19 rapid guideline: managing the long-term effects of COVID-19
NICE guidance on managing Long COVID
The bigger picture
Worldometer summary of coronavirus cases worldwide
European Centre for Disease Prevention and Control info
https://www.ecdc.europa.eu/en/geographical-distribution-2019-ncov-cases
World Health Organisation info
Window on the USA
Centre for Disease Control (CDC)
Find maps and charts tracking cases, deaths, and trends of COVID-19 in the United States.
American Association of Retired People (AARP)
Worcestershire
A local summary of COVID data can be found on the Worcestershire Coronavirus Dashboard.
Note 1: use the arrow <> buttons at the bottom of the Dashboard screen to move between pages.
Note 2: the figures for COVID cases are becoming meaningless as testing is run down.
Note 3: deaths are on page 7, and hospital beds on page 9.
Click for Worcestershire County Council COVID-19 news
There is a colourful webpage offering advice on learning to live with COVID for those aged under 30 years. 'Rona' is slang for Coronavirus.
Click for The Worcestershire 'Rona' Hub
Click for Simple Summary of Malvern numbers on the Coronavirus dashboard
Miscellaneous
Spanish Flu
Dr Jeff Kildea's commentary about the 1919 outbreak of Spanish Flu in Australia
Views of Martin McKee, Professor of European Public Health
Follow Martin McKee on Twitter
Views of Prof Christina Pagel, a member of Independent SAGE
Follow Christina Pagel on Twitter
SAGE membership
Scientific Advisory Group for Emergencies (SAGE)
Scottish government:
Link to Scottish Government website
Link to Postcode checker for COVID restrictions by protection level in areas of Scotland
Welsh Government:
Guidance on COVID alert levels in Wales
Bibliography
Woolhouse, Professor Mark, The Year the World went Mad, published 2022 by Sandstone Press Ltd, ISBN: 978-1-913207-94-3
Medinger Dez, Altmann Danny, The Long Covid Handbook, Penguin Books, 2022. Kindle version available.
![]()
The interpretations and opinions expressed are our own
Last updated 11th April 2023