Angus and Rosemary's Miscellany
of Malvern - Other Resources
|
Coronavirus (COVID-19) epidemic weekly update for Malvern SeniorsCOVID LOCKDOWN - STAY HOME Archived 8th Nov Skip to menu of archived pages PreambleWe keep an eye on the published government figures to asses the level of risk in the Malvern Hills district, if there is an uptick in cases we will tell you. This page is updated every Sunday between 1800 and 2400 hours GMT.
|
 How
to request a test
How
to request a test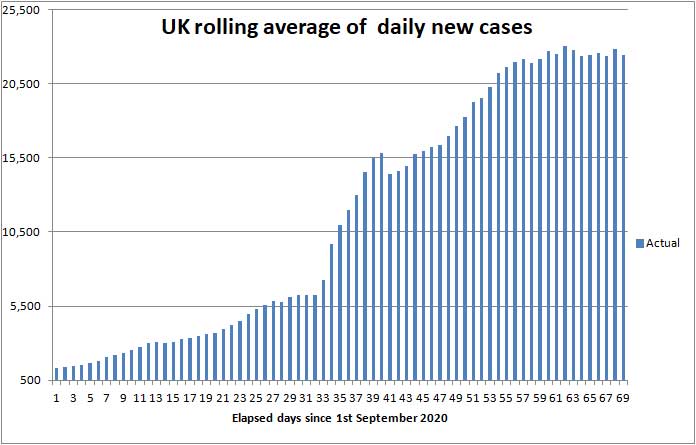
| Districts of Worcs | Cases | Weekly increase | Population |
| Bromsgrove | 1,662 | +210 | 98,529 |
| Malvern Hills | 716 | +90 | 77,545 |
| Redditch | 1,267 | +251 | 85,317 |
| Worcester | 1,269 | +199 | 103,542 |
| Wychavon | 1,352 | +203 | 126,240 |
| Wyre Forest | 1,335 | +246 | 100,957 |
| TOTAL | 7,601 | +1,199 | 592,130 |
| COMPARE WITH | |||
| County of Hereford | 1,713 | +182 | 195,000 |
| Leicester (city of) | 12,539 | +1,369 | 400,000 |
Cumulative cases reported by PHE in Worcestershire to 8th November 2020
These numbers are high enough for Worcestershire to be placed into TIER 2 were it not for the lockdown in England.
Ninety cases of COVID-19 were reported in the Malvern Hills compared to ninety two last week, suggesting R is close to 1 in the Malvern Hills.
At the bottom of the new Coronavirus Dashboard there is an Interactive Map which is coloured to show the variation in infection rates across the country. The darkening colours show how the infection has continued to creep southwards despite the recent control measures.
If you keep clicking the plus sign (+) to enlarge the map eventually you will see for example areas of Malvern, Guarlford and Madresfield; if you click each of these a box pops up which shows the number of cases in the last reported seven days, and a rolling average normalised to 100,000 population per week so rates can be compared across the country.
Note: the Interactive Map works on desktop PCs but you may encounter difficulties using a a tablet or smartphone.
Click for Interactive Map of COVID cases
Recent weekly cases have been Malvern Wells and Priory 4; North Malvern 11; Pickersleigh 3; Malvern Link 4; Barnards Green 6; Callow End, Colletts Green and Hanley 5; Upton and Welland 11. The picture changes daily.
The Malvern Gazette has reported 6 cases of Coronavirus in a doctors' surgery at Cradley.
Number of deaths
Public Health England reports that the cumulative total of COVID (28) deaths in UK hospitals and care homes has risen by 2,327 this week to 49,044 while the rolling 7 day average has increased from 260 to 332 deaths per day; in comparison averaged over recent years 1,700 people die daily from all causes.
Most COVID deaths are currently in the north of England and South Wales where infection rates are highest.
The Office of National Statistics (ONS) separately reports registered deaths in England and Wales where COVID-19 is mentioned on the death certificate. The ONS figures lag the PHE figures by 10 - 14 days and do not include NI and Scotland, so are lower than the figures published by PHE.
The ONS figures are broken down by Hospital Trust so one can see where deaths are occuring. The cumulative total of COVID related deaths in Worcestershire reported by the ONS up to 23rd October is shown below.
These figures will next be updated for the period to 30th October, on 10th November.
| Districts of Worcs | Deaths | Weekly increase | Population |
| Bromsgrove | 134 | 0 | 98,529 |
| Malvern Hills | 47 | 0 | 77,545 |
| Redditch | 60 | +1 | 85,317 |
| Worcester | 64 | 0 | 103,542 |
| Wychavon | 113 | 0 | 126,240 |
| Wyre Forest | 123 | +2 | 100,957 |
| TOTAL | 544 | +3 | 592,130 |
Cumulative COVID deaths registered by ONS to 23rd October 2020
Click for national ONS data on deaths (Excel spreadsheet)
Click to view UK government Coronavirus Dashboard
In England and Wales 1,043 COVID related deaths were reported by ONS in the week to 23rd October, an increase of 327 (46%) on the week before confirming the death rate is accelerating. Of these 163 were in Care Homes, 54 at home, and 812 in hospital. The highest number of hospital deaths by Lower Tier Local Authority were:
Blackburn with Darwen 10, Nottingham 10, County Durham 18, Northumberland 8, Bolton 8, Manchester 15, Oldham 11, Rochdale 10, Stockport 8, Tameside 13, Wigan 22, Knowsley 11, Liverpool 44, St Helens 12, Sefton 23, Wirral 13, Barnsely 10, Doncaster 18, Rotherham 11, Sheffield 8, Sunderland 11, Birmingham 15, Walsall 9, Bradford 13, Kirklees 15, Leeds 23, Rhondda Cynon Taf 13, Aneurin Bevin University Health Board 9, Cwm Taf Morgannwg University Health Board 20.
More recent NHS figures indicate there have been 3 COVID deaths per week in Worcestershire Trust hospitals.
The COVID death rate can be expected to continue accelerating gently during November as those few patients unlucky enough to be severely affected by the second surge of the virus deteriorate. Little can be done to prevent these deaths as they relate to people who have already been infected. As Professor Van Tam says - 'they are baked in'.
Statistician Sir David Spiegelhalter of Cambridge University speaking on BBC TV said that, as a rule of thumb, hospital admissions were likely to be about 10% of new cases, one week after symptoms; and deaths were likely to be about 2% of new cases, 2 to 3 weeks after that - which points towards 450 deaths per day by the end of November.
The death rate should then gradually begin to fall in December as a result of the lockdowns in NI, Wales and England.
Note: Sir David thought forecasts of up 4,000 deaths per day put forward by the PM in order to scare the public and MPs into supporting the second lockdown had been grossly exaggerated.
Healthcare
The UK government Coronavirus Dashboard includes important information about COVID-19 patients in hospital.
| Hospital cases (UK) | Number | Weekly change |
| Patients in hospital | 12,949 | +2,031 |
| Patients on ventilation | 1,185 | +207 |
| Patients admitted daily | 1,621 | +179 |
Headline summary of patients in hospital as of 8th November 2020
Although these headline figures are not updated regularly they show a concerning upward trend.
-
The number of patients in hospital reflects beds that are not available to 'elective' NHS patients. The level is already said to be 60% of that in April when the NHS was overstretched and in those days almost totally devoted to caring for COVID patients.
-
At the height of the epidemic in April the number of patients occupying mechanically ventilated beds reached 3,000 and forty percent of this number are already being used despite ventilators proving less valuable than originally thought.
-
The number of COVID patients admitted daily gives both a measure of how quickly hospitals are filling and more importantly an indication of the death rate to be anticipated in the following month.
Professor Peter Horby of Oxford University said on the Andrew Marr show that up to 20% of COVID patients in hospital could die. If this is correct, the current admission rate of 1,621 new COVID patients per day points to about 325 hospital deaths per day in early December, to which must be added forecast COVID deaths in other settings, such as Care Homes. Adding 25% for the latter suggests an estimate of the order of 400 deaths per day in early December.
It was reported last week that hospitals in Coronavirus hotspots in the NE, NW, Birmingham and South Wales were already approaching capacity. Having acted too late for a second time, the government must be desperately hoping the second lockdown will minimise the damage to elective surgery and emergency departments caused by high numbers of very sick COVID patients.
There still seems doubt about whether the Nightingale Hospitals at Manchester (NW), Sunderland (NE), and Harrogate (Yorkshire and the Humber) will be of much use due to a shortage of doctors and nurses. The media suggests they may be used for COVID patients convalescing once the worst of their illness is past.
Note: very sick COVID patients are said to arrive in hospital 7 to 10 days after first symptoms, and either die or are discharged 15 to 30 days after first symptoms in most cases. Hospital beds are occupied by suspected COVID patients, very sick COVID patients, and a few suffering from 'Long COVID' who may remain in hospital for much longer than 30 days.
Forecast for the week ahead
Trends suggest that during the next seven days (up to 15th November) the cumulative total of UK COVID-19 cases reported by PHE on the Coronavirus Dashboard can be expected to increase by approximately 148,000 towards 1,340,000 cases further increasing pressure on the NHS.
In Worcestershire up to 1,200 new cases of COVID-19 can be expected, and possibly up to 90 cases in the Malvern Hills district.
We estimate the number of COVID (28) deaths can be expected to increase by between 2,800 and 3,500 nationally towards 52,500 leading to increased pressure on undertakers, Ministers of Religion and crematoriums.
By the 15th November the UK death rate is expected to rise towards 450 deaths per day.
In the county of Worcestershire, assuming a 2% death rate, the 1,199 new cases this week could translate to a maximum of 24 Worcestershire deaths per week by early December, but if cases are mostly confined to younger age groups it could be much less.
Looking to the longer term, based on the recent plateau in daily cases and using the 'rules of thumb' mentioned above, likely 400 to 450 UK deaths per day can be expected towards the end of November and in early December. However, in the very worst case, if the present trajectory were to be maintained with deaths doubling every 10 to 14 days, it's not impossible that the national daily death rate could peak at up to 800 deaths per day.
Thereafter as cases hopefully decline following the second lockdown the death rate should slowly fall.
During this 'blip' the storing of bodies in temporary mortuaries and some delay to funeral services should be anticipated between late November and early January when the seasonal death rate goes up.
Providing people act sensibly over Christmas, control measures ought to result in a reduction of new daily cases in December with a consequential gradual fall in the daily death rate in January 2021, by which time there now seems a fair chance the first vaccines may begin to come on stream for NHS staff, care workers, and the elderly.
The illustration below shows additional COVID deaths since 8th September in red and our worst case exponential forecast of deaths in blue up to the end of November.
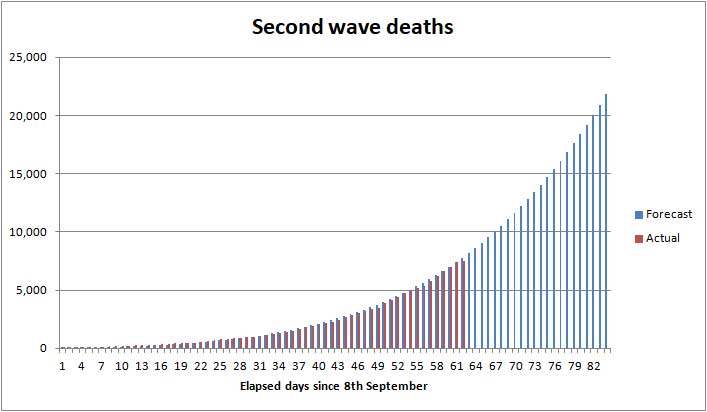
Worst case exponential forecast of Second Wave deaths to 30th November
As a very rough estimate, if a similar number of people were then to die as the Second Wave decays it is possible that the cumulative 2nd wave UK death toll could eventually approach 44,000. Alternatively, and perhaps more realistically, we speculate that if the death rate began levelling off in the second half of November with numbers following an S shaped logistic curve the Second Wave death toll could be as low as 26,000. Somewhere in-between is this week's best guess. Currently the Second Wave death toll stands at 7,450.
In comparison, the First Wave death toll stood at 41,501 on 31st August 2020.
It is difficult, if not impossible, to forecast much further ahead as events in December will first depend on the effectiveness of the second national lockdown, itself dependent on the behavior of the public; and second and to a lesser extent the availability of vaccines.
Advice for Seniors
The COVID virus is spreading increasingly widely and there are pockets of infection across the Malvern Hills and Worcestershire, so we now consider the risk to have become HIGH for Seniors living in the Malvern Hills district; see our riskometer opposite.
If you catch COVID there is a significant chance you will either die or your long term health may be seriously damaged.
During the lockdown in November, subject to exceptions, you must not mix with other households.
The simple safeguards to remember are still to:
-
wash your hands thoroughly for 20 seconds, including after handling deliveries to your home (HANDS) see note 1;
-
wear a face mask when appropriate for example when shopping or visiting the chemist (FACE);
-
avoid mingling especially in crowded places, and continue with precautions such as physical distancing by 2 metres (SPACE) keeping proximity with others brief (TIME) see note 2.
Hence the mantra:-
HANDS, FACE, SPACE, TIME - GET A TEST if you feel unwell
Click for UK government Coronavirus guidance on what you can and cannot do
Remember, if you have symptoms of COVID-19 and can't count from one to ten out loud due to shortness of breath, you should immediately call your GP, 111 or 999 for advice.
Notes:
1) Early on in the epidemic it was advised we should not touch our face to avoid transferring virus from our hands. Difficult to do, but this remains good practice in between thoroughly washing hands.
2) Indoors with poor ventilation, either at home or in small shops, an invisible mist of virus can build up in the air if the space is shared with an infectious person; imagine people exhaling cigarette smoke. Unless you wear a hospital grade face mask you may breath this in; a face covering will offer you little or no protection. The likelihood and extent you get sick will depend on the density of the airborne virus and your exposure time, so best keep the latter short.
Annex to 8th November update
Commentary
Speculation in the media this week has been mostly about the US election, reporting of the counting of the votes, which took several days, and the announcement of Joe Biden as President Elect, who Gordon Brown says is not as sharp as he was but a 'great concilliator'.
The UK daily number of new cases of COVID-19 has been fairly constant over the last 10 days suggesting that the targeted local lockdowns were working and that perhaps the PM was hasty in imposing a 4 week lockdown.
On the other hand cases have been in rising in Worcestershire which should really have been moved from TIER 1 to TIER 2 before now.
Speculation in the media is that the PM was in two minds but that the scoop in the Daily Telegraph forced his hand. The hunt is now on for the MP or official who leaked the story to the press.
The government continues to make a dog's breakfast of control measures and keeps changing its mind. During April and May what the public had to do was fairly clear. During the autumn piecemeal measures were put in place in Coronavirus hotspots. These were then rationalised into Local Coronavirus Alert levels of 3 TIERS announced on 12th October; less than a month later without warning the PM announced a 4 week lockdown. If more notice were given people could at least have booked a haircut!
Logically the lockdown should have been explained by either placing everyone into TIER 3 or if necessary creating a TIER 4, in a similar way to Scotland.
Click to read BBC article about COVID Protection Levels in Scotland
At least its encouraging mass Coronavirus testing will be attempted in Liverpool.
The government postcode checker to tell you what TIER you are in has been replaced by a page about the 5th November lockdown restrictions.
The so called 4 week lockdown is not a strict lockdown of the sort imposed in Italy when the first wave was raging and hospitals could not cope. In fact it seems hardly a lockdown at all.
We are told you should only leave home for the following reasons:
- for education
- for work, if you cannot work from home
- for exercise and recreation outdoors
- for medical reasons
- to shop for food and essentials
- to care for others
You can go to the doctor, hospital, dentist and optician.
Of course non essential retail is now closed and you can't go to the pub but you can shop online and drink at home so that doesn't seem to leave much you can't do!
Care home visits are now in principle allowed subject to restrictions.
It's a shame the government still hasn't been able to coordinate the same control measures across England, Wales, NI and Scotland.
Let's hope this time the government manages to enforce the new rules unlike in the summer when little seemed to be done to control protest marches, parties, and raves.
If it was not for the media, few people in Malvern would know there was a Coronavirus Pandemic. This is partly due to the government keeping the details of most cases confidential. Certainly in rural areas surely if people knew what was going on they would be in a better position to assess the local risk?
Reports of a new strain of Coronavirus linked to mink farms in Denmark are extremely disturbing.
Click to read BBC report about Coronavirus in fur farms
Will the new vaccines provide protection from this strain?
Summary of Links
Symptoms
Article about the effects of Coronavirus on the human body
Reporting and how to obtain a test
How to get a test
https://www.nhs.uk/coronavirus
About joining the Zoe COVID Symptom Study:
Guidance
UK government Coronavirus guidance
Statistics
UK government Coronavirus Dashboard
Coronavirus Dashboard Interactive map
ONS data on deaths in England and Wales (Excel spreadsheet)
Snapshots of deaths in hospital in England. This is not consolidated, so best see the Coronavirus Dashboard to view trends.
Reports
National COVID-19 surveillance reports
ONS Coronavirus (COVID-19) roundup: Deaths and health
The bigger picture
Worldometer summary of coronavirus cases worldwide
European Centre for Disease Prevention and Control info
https://www.ecdc.europa.eu/en/geographical-distribution-2019-ncov-cases
WWorld Health Organisation info
Window on the USA
Centre for Disease Control (CDC)
American Association of Retired People (AARP)
Worcestershire
Help
http://www.worcestershire.gov.uk/here2help
Outbreak Control Plan
http://www.worcestershire.gov.uk/coronavirus
Miscellaneous
Spanish Flu
Dr Jeff Kildea's commentary about the 1919 outbreak of Spanish Flu in Australia
Views of Martin McKee, Professor of European Public Health
Follow Martin McKee on Twitter
SAGE membership
Scientific Advisory Group for Emergencies (SAGE)
Scottish government:
Link to Scottish Government website
![]()
The interpretations and opinions expressed are our own
Last updated 9th November 2020