Angus and Rosemary's Miscellany
of Malvern - Other Resources
|
Coronavirus (COVID-19) epidemic weekly update for Malvern SeniorsCOVID LOCKDOWN - STAY HOME Archived 29th November 2020 Skip to menu of archived pages PreambleWe keep an eye on the published government figures to asses the level of risk in the Malvern Hills district, if there is an uptick in cases we will tell you. This page is updated every Sunday between 1800 and 2400 hours GMT.
|
 How
to request a test
How
to request a test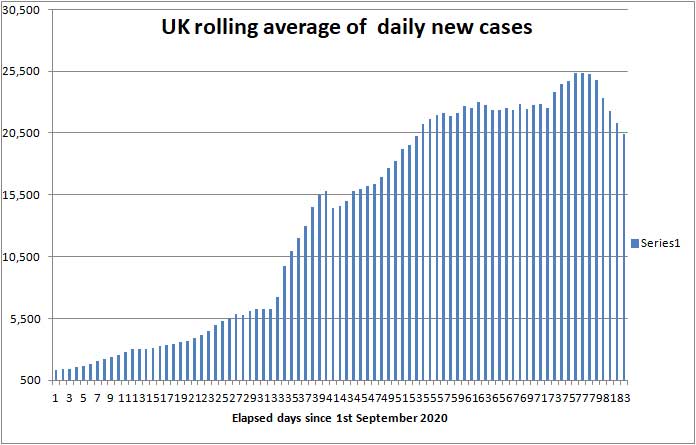
| Districts of Worcs | Cases | Weekly increase | Population |
| Bromsgrove | 2,132 | +225 | 98,529 |
| Malvern Hills | 867 | +76 | 77,545 |
| Redditch | 1,813 | +250 | 85,317 |
| Worcester | 1,774 | +177 | 103,542 |
| Wychavon | 1,753 | +184 | 126,240 |
| Wyre Forest | 1,859 | +261 | 100,957 |
| TOTAL | 10,198 | +1,174 | 592,130 |
| COMPARE WITH | |||
| County of Hereford | 2,309 | +255 | 195,000 |
| Leicester (city of) | 16.390 | +1,875 | 400,000 |
Cumulative cases reported by PHE in Worcestershire to 22nd November 2020
Unless these numbers are further reduced Worcestershire may well be placed into TIER 2 when the lockdown ends on 2nd December.
At the bottom of the new Coronavirus Dashboard there is an Interactive Map which is coloured to show the variation in infection rates across the country. The darkening colours show how the infection has continued to strengthen and creep southwards into Staffordshire, and leach from Birmingham into Worcestershire.
If you keep clicking the plus sign (+) to enlarge the map eventually you will see for example areas of Malvern, Guarlford and Madresfield; if you click each of these a box pops up which shows the number of cases in the last reported seven days, and a rolling average normalised to 100,000 population per week so rates can be compared across the country.
Note: the Interactive Map works on desktop PCs but you may encounter difficulties using a tablet or smartphone.
Click for Interactive Map of COVID cases
Recent weekly cases to 17th Nov have been Malvern Wells and Priory 6; North Malvern 9; Malvern Link 3; Callow End, Colletts Green and Hanley 7; Upton and Welland 8. There has been a small and welcome fall in cases; the picture changes daily.
Number of deaths
Public Health England reports that the cumulative total of COVID (28) deaths in UK hospitals and care homes has risen by 3,090 this week to 55,042 while the rolling 7 day average has risen only slightly from 413 to 440 deaths per day; in comparison averaged over recent years 1,700 people die daily from all causes.
Most COVID deaths are currently in the north of England and South Wales where infection rates are highest, but deaths are now beginning to occur in Worcestershire (see commentary).
The Office of National Statistics (ONS) separately reports registered deaths in England and Wales where COVID-19 is mentioned on the death certificate. The ONS figures lag the PHE figures by 10 - 14 days and do not include NI and Scotland, so are lower than the more recent figures published by PHE.
The ONS figures are broken down by Hospital Trust so one can glimpse where deaths are occurring. The cumulative total of COVID related deaths in Worcestershire reported by the ONS up to 6th November is shown below.
| Districts of Worcs | Deaths | Weekly increase | Population |
| Bromsgrove | 136 | +2 | 98,529 |
| Malvern Hills | 48 | +1 | 77,545 |
| Redditch | 62 | +1 | 85,317 |
| Worcester | 65 | 0 | 103,542 |
| Wychavon | 116 | +2 | 126,240 |
| Wyre Forest | 127 | 0 | 100,957 |
| TOTAL | 554 | +6 | 592,130 |
Cumulative COVID deaths registered by ONS to 6th November 2020
In the week ending 6th November, there were 6 COVID deaths in Worcestershire, of which 2 were in care homes and 4 in hospital. More recently in the seven days ending 20th November NHS England reported 10 deaths in hospital; a small number compared to the national picture.
Click for national ONS data on deaths (Excel spreadsheet)
Click to view UK government Coronavirus Dashboard
In total in England and Wales 2,103 COVID related deaths were reported by ONS in the week to 6th November, an increase of 603 (40%) on the week before confirming the death rate continued to accelerate during this period. Of these 303 were in Care Homes, 89 at home, and 1,687 in hospital. The highest number of hospital deaths by Lower Tier Local Authority were:
Nottingham 18, County Durham 21, Bury 24, Manchester 24, Oldham 30, Rochdale 31, Salford 16, Tameside 22, Wigan 42, Knowsley 17, Liverpool 47, Sefton 28, Wirral 20, Barnsely 17, Doncaster 25, Rotherham 21, Sheffield 31, Sunderland 17, Birmingham 41, Dudley 15, Bradford 22, Kirklees 26, Leeds 46, Wakefield 17, Bridgend 15, Rhondda Cynon Taf 30, Blaenau Gwent 15, Aneurin Bevin University Health Board 45, Cwm Taf Morgannwg University Health Board 53, Swansea Bay University Health Board 17.
During the last week the rise in the COVID death rate has begun to slow markedly.
Note: Statistician Sir David Spiegelhalter of Cambridge University speaking on BBC TV said that, as a rule of thumb, hospital admissions were likely to be about 10% of new cases, one week after symptoms; and deaths were likely to be about 2% of new cases, 2 to 3 weeks after that - which points towards 408 deaths per day by mid December.
On the 16th November The Worcester News reported a very serious outbreak of COVID at St Stephen's Care Home in Worcester. Thirty three residents and twenty three staff have tested COVID positive and so far three residents have died.
Healthcare
The UK government Coronavirus Dashboard includes important information about COVID-19 patients in hospital.
| Hospital cases (UK) | Number | Weekly change |
| Patients in hospital | 16,390 | +1,475 |
| Patients on ventilation | 1,421 | +66 |
| Patients admitted daily | 1,746 | -176 |
Headline summary of patients in hospital as of 22nd November 2020
Although these headline figures are not updated regularly, they are useful indicators.
-
The number of patients in hospital reflects beds that are not available to 'elective' NHS patients. It is reassuring the increase in occupied beds appears to have almost reached a peak.
-
At the height of the epidemic in April the number of patients occupying mechanically ventilated beds reached 3,000 and on average forty five percent of this number are already being used; more so in some hospitals. At least the rate of increase in use of ventilators has slowed.
-
The number of COVID patients admitted daily gives both a measure of how quickly hospitals are filling and more importantly an indication of the death rate to be anticipated in the following month.
Professor Peter Horby of Oxford University said on the Andrew Marr show that up to 20% of COVID patients in hospital could die. If this is correct, the current admission rate of 1,746 new COVID patients per day points to about 350 hospital deaths per day in early December, to which must be added forecast COVID deaths in other settings, such as Care Homes. Adding 25% for the latter suggests an estimate of the order of 440 deaths per day in mid December.
Note: very sick COVID patients are said to arrive in hospital 7 to 10 days after first symptoms, and either die or are discharged 15 to 30 days after first symptoms in most cases. Hospital beds are occupied by suspected COVID patients, very sick COVID patients, and a few suffering from 'Long COVID' who may remain in hospital for much longer than 30 days.
The Malvern Gazette reports that the number of COVID patients in Worcestershire hospitals is currently high, but so far there has been no reply from the Trust indicating whether or not there is anything to worry about.
Forecast for the week ahead
Trends suggest that during the next seven days (up to 29th November) the cumulative total of UK COVID-19 cases reported by PHE on the Coronavirus Dashboard can be expected to increase by about 120,000 towards 1,632,000 cases.
In Worcestershire up to 1,000 new cases of COVID-19 can be expected, and possibly up to 70 cases in the Malvern Hills district.
The exponential rise in deaths during September and October has slowed considerably, so we now estimate the number of COVID (28) deaths will increase by about 2,800 nationally towards 57,850 during the 7 days ending 29th November when the UK daily death rate is expected to flat-line at no more than 440 deaths per day.
In the county of Worcestershire, assuming a 2% death rate, the 1,115 new cases this week could translate to a maximum of 22 Worcestershire deaths per week by mid December, but if cases are mostly confined to younger age groups it could be less. In the 7 days to 20th November NHS England reported 10 COVID deaths in Worcestershire NHS hospitals (see commentary).
Looking to the longer term, based on the recent flat-lining and now dipping of daily cases and using the 'rules of thumb' mentioned above, we think likely the death rate expressed as a 7 day rolling average could fall to about 410 deaths per day by the end of November and could begin to fall further in early December.
The chart below shows deaths to date in red and a possibly optimistic projection of future COVID deaths up to the end of December in blue which assumes the death rate falls progressively to 100 deaths per day by the end of the year.
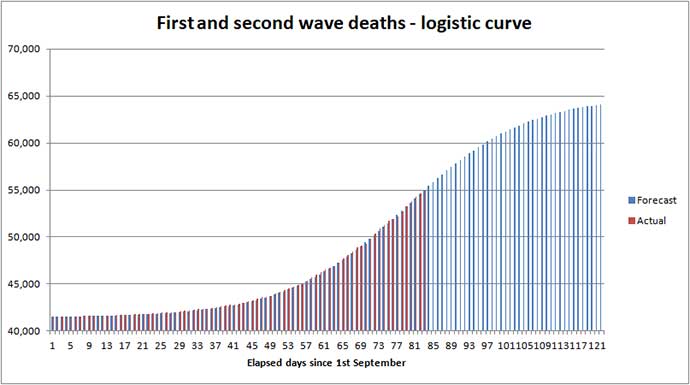
Revised forecast of cumulative deaths to 31st December
For a short period, while the second wave death rate is near its peak, the storing of bodies in temporary mortuaries and some delay to funeral services cannot be ruled out between now and early January.
Providing people continue to act sensibly following the end of the second lockdown and over Christmas 'adequate' control measures should result in a marked reduction of new daily cases in December with a consequential further slowing of the daily death rate in January 2021, by which time the first vaccines may begin to come on stream for small numbers of NHS staff, care workers, and the elderly.
It will probably be towards the summer before a significant fraction of the UK population is vaccinated, but Seniors should take heart that they are likely to be near the front of the queue.
Advice for Seniors

COVID is now widespread and there are pockets of infection across the Malvern Hills and Worcestershire so we consider the risk to be HIGH for Seniors living in the Malvern Hills district, though not very high; see our commentary and riskometer opposite.
If you catch COVID there is a significant chance that you will either die or your long term health may be seriously damaged, so take care to protect yourself and those you love. 90% of COVID deaths are in those aged over 60 years according to NHS England statistics.
During the lockdown in November, subject to exceptions, you must not mix with other households.
The simple safeguards to remember are still to:
-
wash your hands thoroughly for 20 seconds, including after handling deliveries to your home (HANDS) see note 1;
-
wear a face mask when appropriate for example when shopping or visiting the chemist (FACE);
-
avoid mingling especially in crowded places, and continue with precautions such as physical distancing by 2 metres (SPACE) keeping proximity with others brief (TIME) see note 2.
Hence the mantra:-
HANDS, FACE, SPACE, TIME - GET A TEST if you feel unwell
Click for UK government Coronavirus guidance on what you can and cannot do
Remember, if you have symptoms of COVID-19 and can't count from one to ten out loud due to shortness of breath, you should immediately call your GP, 111 or 999 for advice.
Notes:
1) Wash your hands thoroughly before touching your face to avoid transferring virus from surfaces to your mouth, eyes and nose.
2) Minimise time spent mixing with others in indoor settings - an invisible mist of virus can build up in the air if the space is shared with an infectious person; imagine people exhaling cigarette smoke. Unless you wear a hospital grade face mask you can breath this in; a face covering will offer little or no protection. The likelihood and extent you get sick will depend on the density of the airborne virus and your exposure time.
Annex to 22nd November update
Commentary
Attention in the media this week has centred on when COVID vaccines might be rolled out, and speculation about possible relaxation of control measures over Christmas.
The official report into accusations of bullying by Home Secretary Priti Patel was a side show. Click to read BBC article
Health Secretary Matt Hancock hopes to coordinate, with the devolved administrations of the UK, simplified rules allowing families to meet at Christmas. Currently the situation is a dog's breakfast - read below to find out what is currently happening in other parts of the UK.
The debate over trading peoples lives for a roast dinner looks set to continue for a while.
Scotland
Nicola Sturgeon has placed more of Scotland into Tier 4 equivalent to the present lockdown in England.
Coronavirus (COVID-19) update: First Minister’s statement – Friday 20 November 2020
Wales
The two week firebreak in Wales ended on 9th November when the First Minister of Wales, Mark Drakeford, announced the new measures to follow:
Click to view press release on new measures in Wales
It appears pubs can reopen, but theatres remain closed.
Northern Ireland
The 4 week lockdown in Northern Ireland which ended on 20th November hasn't achieved the results expected so will be extended from 27th November for a further 2 weeks.
Click for BBC report, Coronavirus: What do NI's restrictions mean for you?
BBC investigation: Lockdown 1.0 - Following the science?
The BBC broadcast an interesting programme on 19th November, on BBC2 TV, highlighting some of the mistakes made during the first COVID lockdown. You can watch this on the BBC Iplayer, else click this link. Note: you may need to sign in to your BBC account to run the video.
Test and Trace
The BBC has carried out another expose into why Test and Trace is performing poorly. It's a long story:
Click to read BBC report, Coronavirus: Inside test-and-trace - how the 'world beater' went wrong
Recent deaths in Worcestershire hospitals
The table below shows recent COVID deaths in Worcestershire Acute Hospitals Trust reported by NHS England to 20th November.
| Date | Number |
| 14th November | +3 (updated) |
| 15th November | 0 |
| 16th November | +2 |
| 17th November | +1 |
| 18th November | +1 |
| 19th November | +2 |
| 20th November | 0 |
| Total | +9 |
Worcester Acute Trust hospitals COVID deaths in 7 days to 20th November
One death was reported in Worcestershire Health and Care Trust hospitals during this period, making a total of 10 deaths in all.
To date a total of 318 COVID deaths have been reported in Worcester Acute hospitals and 30 in 'Care' hospitals.
Relative risk of COVID-19 death by age band
NHS England provides an analysis of COVID-19 deaths by age band. In the table below we have added an extra column showing risk relative to adults in the 20 - 39 years age band. Those aged 40 - 59 are 11 times more likely to die; those aged 60 - 79 are 56 time more likely to die; and those aged over 80 years are 79 times more likely to die. The lesson is that those over 60 should take special care and be treated with consideration.
| Age band | Number of deaths | % of deaths | Relative risk |
| 0 - 19 | 22 | 0.06 | 0.09 |
| 20 - 39 | 247 | 0.68 | 1 |
| 40 - 59 | 2,682 | 7.34 | 11 |
| 60 - 79 | 13,953 | 38.2 | 56 |
| 80+ | 19,608 | 53.7 | 79 |
Relative risk of COVID-19 death by age band
Present rate of new cases
The current average rate of infection per 100,000 population per week in England is 259. In comparison the figure for Worcestershire is currently 231 and that in the Malvern Hills 102. So the Malvern Hills is the safest district in Worcestershire and compares well with the city of Leicester where the rate is 490.
Nevertheless in normal times a figure of 50 woud be considered too high, so Seniors should continue to take care.
The probability of catching Coronavirus in the Malvern Hills is moderate, but combined with the significant risk of death makes us view the overall risk to Seniors as HIGH. If Seniors were to visit hotspots such as Bristol, Staffordshire, Leicester or Hull we would assess the risk VERY HIGH.
The risk of death from Coronavirus for healthy teenagers is exceedingly small so for them the risk is LOW.
Forecast of death rate during December
Matt Hancock says he looks at the numbers and doesn't make forecasts, and he is right as Health Secretary to take that position. However we have made a rough estimate of what might happen - one can't go far wrong extrapolating a week ahead, which we usually do, but estimating the likely death rate one month ahead is a mugs game and little more than a shot in the dark.
Using an Excel spreadsheet, we have fitted the actual death rate to an S shaped curve (or logistic function) and used that to project how the death rate might fall in December; see chart below.
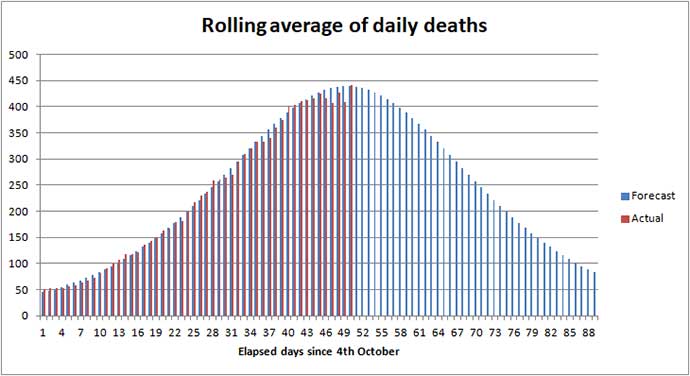
Illustration of possible death rate to 31st December
The present death rate will fall, but there is considerable uncertainty about how fast and whether there will be bumps in the road for example caused by a third wave of Coronavirus due to restrictions being eased over Christmas. We will just have to wait and see what actually happens!
Summary of Links
Symptoms
Article about the effects of Coronavirus on the human body
Reporting and how to obtain a test
How to get a test
https://www.nhs.uk/coronavirus
About joining the Zoe COVID Symptom Study:
Guidance
UK government Coronavirus guidance
Statistics
UK government Coronavirus Dashboard
Coronavirus Dashboard Interactive map
ONS data on deaths in England and Wales (Excel spreadsheet)
Snapshots of deaths in hospital in England. This is not consolidated, so best see the Coronavirus Dashboard to view trends.
Reports
National COVID-19 surveillance reports
ONS Coronavirus (COVID-19) roundup: Deaths and health
The bigger picture
Worldometer summary of coronavirus cases worldwide
European Centre for Disease Prevention and Control info
https://www.ecdc.europa.eu/en/geographical-distribution-2019-ncov-cases
WWorld Health Organisation info
Window on the USA
Centre for Disease Control (CDC)
American Association of Retired People (AARP)
Worcestershire
Help
http://www.worcestershire.gov.uk/here2help
Outbreak Control Plan
http://www.worcestershire.gov.uk/coronavirus
Miscellaneous
Spanish Flu
Dr Jeff Kildea's commentary about the 1919 outbreak of Spanish Flu in Australia
Views of Martin McKee, Professor of European Public Health
Follow Martin McKee on Twitter
SAGE membership
Scientific Advisory Group for Emergencies (SAGE)
Scottish government:
Link to Scottish Government website
Link to Postcode checker for COVID restrictions by protection level in areas of Scotland
Welsh Government:
Guidance on how you can keep safe during the outbreak and what rules are in place to protect people
![]()
The interpretations and opinions expressed are our own
Last updated 23rd November 2020