Angus and Rosemary's Miscellany
of Malvern - Other Resources
|
Coronavirus (COVID-19) epidemic weekly update for Malvern SeniorsCOVID LOCKDOWN REPLACED BY TIER 2 CONTROL MEASURES on 2nd December Archived 6th December 2020 Skip to menu of archived pages T'is the Season to be Jolly Careful - says the Prime Minister PreambleWe keep an eye on the published government figures to asses the level of risk in the Malvern Hills district, if there is an uptick in cases we will tell you. This page is updated every Sunday between 1800 and 2400 hours GMT. Information about Coronavirus can be found on the NHS website: https://www.nhs.uk/coronavirus
|
 How
to request a test
How
to request a test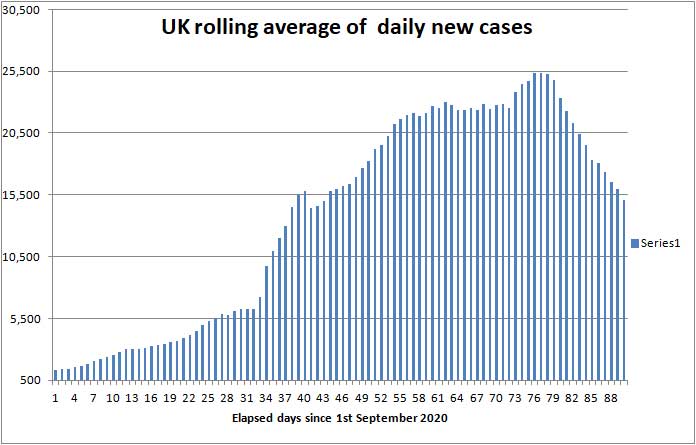
| Districts of Worcs | Cases | Weekly increase | Population |
| Bromsgrove | 2,274 | +142 | 98,529 |
| Malvern Hills | 921 | +54 | 77,545 |
| Redditch | 1,984 | +171 | 85,317 |
| Worcester | 1,866 | +92 | 103,542 |
| Wychavon | 1,856 | +103 | 126,240 |
| Wyre Forest | 1,859 | +152 | 100,957 |
| TOTAL | 10,912 | +714 | 592,130 |
| COMPARE WITH | |||
| County of Hereford | 2,440 | +131 | 195,000 |
| Leicester (city of) | 17,421 | +1,072 | 400,000 |
Cumulative cases reported by PHE in Worcestershire to 29th November 2020
At the bottom of the Coronavirus Dashboard there is an Interactive Map which is coloured to show the variation in infection rates across the country. The rapidly shrinking patches of purple suggest the infection has begun reducing in the north, counterbalanced by newly emerging hotspots in Bristol and Swale in Kent.
If you keep clicking the plus sign (+) to enlarge the map eventually you will see for example areas of Malvern, Guarlford and Madresfield; if you click each of these a box pops up which shows the number of cases in the last reported seven days, and a rolling average normalised to 100,000 population per week so rates can be compared across the country.
Note: the Interactive Map works on desktop PCs but you may encounter difficulties using a tablet or smartphone.
Click for Interactive Map of COVID cases
Recent weekly cases to 24th Nov have been: Malvern Wells and Priory 6; North Malvern 3; Malvern Link 5; Callow End, Colletts Green and Hanley 4; Upton and Welland 9; the picture changes daily.
Number of deaths
Statistics on deaths are published by Public Health England, The Office of National Statistics, and NHS England.
PHE figures
Public Health England reports that the cumulative total of COVID (28) deaths in UK hospitals and care homes has risen by 3,221 this week to 58,245 while the rolling 7 day average has risen only slightly from 440 to 460 deaths per day; in comparison averaged over recent years 1,700 people die daily from all causes.
Most of these COVID deaths are currently in the north of England and South Wales where infection rates are highest.
The second wave COVID-19 death rate appears to be nearing its peak and we shortly expect it to begin falling.
Click to view the UK government Coronavirus Dashboard
ONS figures
The Office of National Statistics (ONS) separately reports registered deaths in England and Wales where COVID-19 is mentioned on the death certificate. The ONS figures lag the PHE figures by 10 - 14 days and do not include NI and Scotland, so are lower than the figures published by PHE.
The figures are broken down by District so one can glimpse where deaths are occurring. The cumulative total of COVID related deaths in Worcestershire reported by the ONS up to 13th November is shown below.
| Districts of Worcs | Deaths | Weekly increase | Population |
| Bromsgrove | 136 | 0 | 98,529 |
| Malvern Hills | 49 | +1 | 77,545 |
| Redditch | 64 | +2 | 85,317 |
| Worcester | 67 | +2 | 103,542 |
| Wychavon | 119 | +3 | 126,240 |
| Wyre Forest | 129 | +2 | 100,957 |
| TOTAL | 564 | +10 | 592,130 |
Cumulative COVID deaths registered by ONS to 13th November 2020
In the week ending 13th November, there were 10 COVID deaths in Worcestershire, of which 1 was in a hospice and 9 in hospital.
In total in England and Wales 2,654 COVID related deaths were reported by ONS in the week to 13th November, an increase of 551 (26%) on the week before showing the death rate continued to rise, though not so fast as the week before. Of these 461 were in Care Homes, 122 at home, and 2,033 in hospital. The highest number of hospital deaths (>19) by Lower Tier Local Authority were:
Stoke on Trent 27, County Durham 25, Manchester 26, Oldham 35, Rochdale 31, Salford 20, Wigan 47, Liverpool 32, Sefton 27, Barnsely 24, Doncaster 34, Rotherham 22, Sheffield 34, Birmingham 54, Sandwell 24, Walsall 22, Bradford 30, Kirklees 28, Leeds 40, Wakefield 30, Havering 24, Aneurin Bevin University Health Board 45, Cwm Taf Morgannwg University Health Board 44, Swansea Bay University Health Board 23.
Click for national ONS data on deaths (Excel spreadsheet)
NHS England figures
More recently in the seven days ending 27th November NHS England reported 20 deaths in Worcestershire hospitals.
Click for NHS COVID-19 Daily Deaths
Healthcare numbers
The UK government Coronavirus Dashboard includes important information about COVID-19 patients currently in hospital.
| Hospital cases (UK) | Number | Weekly change |
| Patients in hospital | 15,712 | -678 |
| Patients on ventilation | 1,417 | -4 |
| Patients admitted daily | 1,571 | -175 |
Headline summary of patients in hospital as of 29th November 2020
Although these headline figures are not updated regularly, they are useful indicators.
-
The number of patients in hospital reflects beds that are not available to 'elective' NHS patients; this appears to have reached a peak and has fallen slightly.
-
At the height of the epidemic in April the number of patients occupying mechanically ventilated beds reached 3,000 and on average forty seven percent of that number are now being used; the good news is the number of ventilators in use has stopped rising.
-
The number of COVID patients admitted daily gives both a measure of how quickly hospitals are filling and more importantly an indication of the death rate to be anticipated in the following month (see next section).
Very sick COVID patients are said to arrive in hospital 7 to 10 days after first symptoms, and either die or are discharged 15 to 30 days after first symptoms in most cases. Hospital beds are occupied by suspected COVID patients, very sick COVID patients, and a few suffering from 'Long COVID' who may remain in hospital for much longer than 30 days.
Notes on projected figures
It appears hospitals are only admitting very sick COVID-19 patients, for example those with breathing difficulties, which is probably why Professor Peter Horby of Oxford University said on the Andrew Marr show that up to 20% of COVID patients in hospital could die.
If this is correct, the current admission rate of 1,571 new COVID patients per day points to about 314 hospital deaths per day, to which must be added forecast COVID deaths in other settings such as Care Homes. Adding 25% for the latter suggests an estimate of the order of 393 deaths per day around Christmas.
Statistician Sir David Spiegelhalter of Cambridge University speaking separately on BBC TV said that, using his rule of thumb, hospital admissions were likely to be about 10% of reported new cases, one week after symptoms; and deaths were likely to be about 2% of new cases, 2 to 3 weeks after that - which would point towards about 300 deaths per day in the second half of December.
During September and October the actual second wave numbers fitted a truncated exponential series which we used to forecast a week ahead. Since then the rate has slowed - approximating more closely to an S shaped Logistic curve which we have used as a guide in producing the forecast below.
Forecast for the week ahead
Trends suggest that during the next seven days (up to 6th December) the cumulative total of new UK COVID-19 cases reported by PHE on the Coronavirus Dashboard can be expected to increase by about 85,000 towards 1,703,000 cases.
In Worcestershire up to 700 new cases of COVID-19 can be expected, and possibly up to 60 cases in the Malvern Hills district.
As the (average) daily death rate seems to be nearing a peak of about 460 deaths per day we estimate the number of COVID (28) deaths will increase by about 3,100 nationally towards 61,345 during the 7 days ending 6th December
In the county of Worcestershire, assuming a 2% death rate, the 714 new cases this week could translate to a maximum of 15 Worcestershire deaths per week in the latter half of December, but if cases are mostly confined to younger age groups it could be less.
Longer term forecast
Looking to the longer term, based on the recent fall in daily new cases and using the 'rules of thumb' mentioned above, we anticipate the national daily death rate will gradually decline during December (see commentary).
The chart below shows deaths to date in red and a revised projection of future COVID deaths up to the end of December in blue which assumes the death rate falls progressively towards 200 deaths per day by the end of the year.
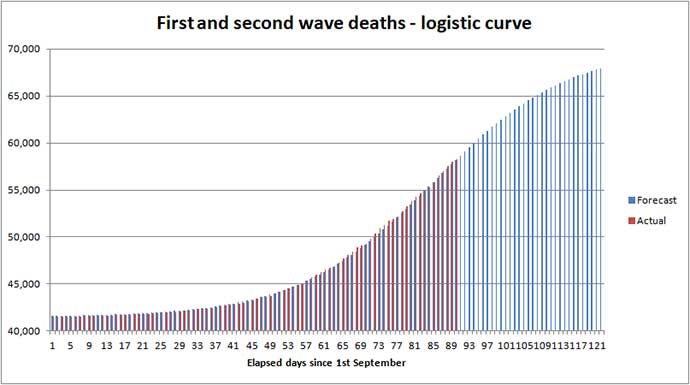
Revised forecast of cumulative COVID deaths to 31st December
For a short period, while the second wave death rate is near its peak, the storing of bodies in temporary mortuaries and some delay to funeral services cannot be ruled out between now and early January.
Providing people continue to act sensibly following the end of the second lockdown and over Christmas there could be a further reduction of daily new cases in December with a consequential further slowing of the daily death rate in January 2021, by which time the first vaccines may begin to come on stream for small numbers of NHS staff, care workers, and the elderly. That is the rosy picture.
More likely however there could be a third wave of the COVID epidemic in January, caused by excessive travel and mingling over Christmas, leading to a possible extension of restrictions, which many MPs and business leaders attempt to resist.
Realistically, it may take until the summer to vaccinate a significant fraction of the UK population, but Seniors should take heart that they are likely to be near the front of the queue.
Advice for Seniors
COVID is still widespread and there are pockets of infection across the Malvern Hills and Worcestershire so we consider the risk to be HIGH for Seniors living in the Malvern Hills district, though not very high; see our commentary and riskometer opposite.
If you catch COVID there is a significant chance that you will either die or your long term health may be seriously damaged, so take care to protect yourself and those you love. 90% of COVID deaths are in those aged over 60 years according to NHS England statistics.
Prior to Christmas you must not mix with other households.
Although the government will be easing restrictions over Christmas, risk averse Seniors should consider not mixing indoors in large family groups. Instead, perhaps consider inviting a lonely friend round for Christmas lunch and communicating with family using either Skype, Facetime or Zoom.
The simple safeguards to remember are still to:
-
wash your hands thoroughly, using soap and hot water, for 20 seconds, including after handling deliveries to your home (HANDS) see note 1;
-
wear a face mask when appropriate for example when shopping or visiting the chemist (FACE);
-
avoid mingling especially in crowded places, and continue with precautions such as physical distancing by 2 metres (SPACE) keeping proximity with others brief (TIME) see notes 2 and 3.
Hence the mantra:-
HANDS, FACE, SPACE, TIME - GET A TEST if you feel unwell.
Click for UK government Coronavirus guidance on what you can and cannot do
Remember, if you have symptoms of COVID-19 and can't count from one to ten out loud due to shortness of breath, you should immediately call your GP, 111 or 999 for advice.
Notes:
1) Wash your hands thoroughly before touching your face to avoid transferring virus from surfaces to your mouth, eyes and nose. If outdoors use hand gel.
2) Minimise time spent mixing with people outside your household in indoor settings - an invisible mist of virus can build up in the air if the space is shared with an infectious person; imagine people exhaling cigarette smoke. Unless you wear a hospital grade face mask you can breath this in; a face covering will offer little or no protection. The likelihood and extent you get sick will depend on the density of the airborne virus, which can be reduced by ventilation, and your exposure time.
3) Two metres is further than you think, and roughly an arm and a walking stick away - difficult to chat if the person you are talking to is hard of hearing!
Annex to 29th November update
Commentary
Speculation in the media this week has been about the timing of the COVID vaccination programme, the introduction of the new TIERS of control following the ending of the second lockdown in England, and the relaxation of restrictions over the Christmas holiday.
Tiers of control
As expected Worcestershire will move into Tier 2 when the present lockdown ends; that means we must not mix with other households, which could make visiting grand children difficult. Otherwise we can do very much everything else, whilst observing the Hands, Face, Space guidance.
Relaxation of controls over Christmas
The debate over trading people's lives for a roast dinner looks to have been settled.
The government and devolved administrations have accepted that families will get together at Christmas whatever they say and are proposing relaxation of the restrictions hoping to limit the damage. See press release:
UK-wide Christmas arrangements agreed by the UK Government and the Devolved Administrations
The main points are:
1) Travel restrictions across the four administrations and between tiers will be lifted to provide a window for households to come together between the 23rd and 27th of December.
2) Up to three households can form an exclusive ‘bubble’ to meet at home during this period. When a bubble is formed it is fixed, and must not be changed or extended further at any point.
3) Each Christmas bubble can meet at home, at a place of worship or an outdoor public place, but existing, more restrictive rules on hospitality and meeting in other venues will be maintained throughout this period.
However, freedom to travel across the country for coronavirus parties has potential to spark a third wave of the epidemic, leading to more deaths especially in the 60+ age band (see below).
The government seems largely to have relinquished responsibility, so it is ultimately for us Seniors to decide, based on personal circumstances, how much risk to take this Christmas.
Quantifying the danger of mingling at Christmas
Relaxation of restrictions over Christmas will lead to additional deaths and likely a third wave of the epidemic. Here is a back of the envelope worst case calculation:
Assume 66 million people in the UK, who divide into bubbles of 10 creating 6.6 million bubbles. Assuming an infection rate of 100 per 100,000 then 1% of bubbles will contain at least one infectious person, that is 66,000 bubbles. Cooped up indoors together assume the other 9 in the bubble are infected, suggesting a worst case of 600,000 new 'index' COVID cases due to relaxation of the COVID restrictions - a huge number.
If people of all ages mix then 2% can be expected to die, perhaps 12,000 immediate additional deaths in the second half of January, of which 90% would be aged 60+ years, to which would have to be added later deaths amongst their contacts.
The message seems clear: the easing of restrictions over Christmas would very likely lead to a third wave of the epidemic and a significant number of deaths.
However looked at from another angle the majority of family gatherings (>99%) would probably be infection free.
Our recommendation is that risk averse Seniors should consider declining Christmas gatherings this year, unless they have a life limiting condition and feel that this may be their last. That would not in itself prevent a third wave of the epidemic but could reduce additional deaths to 1,000 in those aged under 60 years.
Vaccination
The Pfizer, Moderna and Oxford vaccines are showing promise but still need to be approved, manufactured, distributed and a programme of vaccination rolled out. The government hints that vaccination could start in early January with significant progress being made by the spring, whilst other commentators suggest that more realistically it may take until the summer to vaccinate say 50% of the UK population.
Recent deaths in Worcestershire hospitals
The table below shows an uplift in COVID deaths in Worcestershire Acute Hospitals Trust reported by NHS England to 27th November.
| Date | Number |
| 21st November | 1 |
| 22nd November | 2 |
| 23rd November | 5 |
| 24th November | 1 |
| 25th November | 4 |
| 26th November | 5 |
| 27th November | 1 |
| Total | 19 |
Worcester Acute Trust hospitals COVID deaths in 7 days to 27th November
1 death was reported in Worcestershire Health and Care Trust hospitals during this period, making a total of 20 deaths in all.
To date a total of 339 COVID deaths have been reported in Worcester Acute hospitals and 31 in 'Care' hospitals.
Present rate of new cases
This week, the average rate of infection per 100,000 population per week in England fell from 259 to 175. In comparison the figure for Worcestershire is 143 and that in the Malvern Hills 66. So the Malvern Hills remains the safest district in Worcestershire and compares well with the city of Leicester where the rate of infection is seven times higher.
Nevertheless in normal times a figure of 50 would be considered too high, so Seniors should continue to be careful.
The probability of catching Coronavirus in the Malvern Hills is moderate, and falling this week, but combined with the significant risk of death makes us view the overall risk to Seniors as still HIGH. If Seniors were to visit hotspots such as Bristol, Staffordshire, Leicester or Hull we would assess the risk VERY HIGH.
The risk of death from Coronavirus for healthy teenagers is exceedingly small so for them the risk is LOW, whereas the middle aged can suffer from Long COVID so for them the risk might be assessed MODERATE.
Forecast of death rate during December
Last week we made a rough estimate of the future daily death rate - emphasising that while one can't go far wrong extrapolating a week ahead, forecasting the death rate one month ahead is little more than a shot in the dark.
Using an Excel spreadsheet, we fitted the actual death rate to an S shaped curve (or logistic function) and used that to project how the death rate might fall in December. However during the last week the actual death rate roughly flat-lined rather than declining so we have delayed the peak in the curve; see chart below.
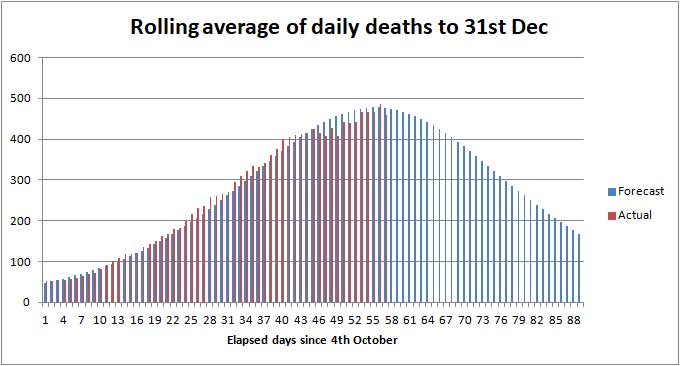
Illustration of possible death rate to 31st December
The present COVID death rate of 460 deaths per day will fall, but there is considerable uncertainty about how fast and whether there will be bumps in the road for example caused by a third wave of Coronavirus due to restrictions being eased over Christmas. We will just have to wait and see what actually happens!
Summary of Links
Symptoms
Article about the effects of Coronavirus on the human body
Reporting and how to obtain a test
How to get a test
https://www.nhs.uk/coronavirus
About joining the Zoe COVID Symptom Study:
Guidance
UK government Coronavirus guidance
Statistics
UK government Coronavirus Dashboard
Coronavirus Dashboard Interactive map
ONS data on deaths in England and Wales (Excel spreadsheet)
Snapshots of deaths in hospital in England. This is not consolidated, so best see the Coronavirus Dashboard to view trends.
Reports
National COVID-19 surveillance reports
ONS Coronavirus (COVID-19) roundup: Deaths and health
The bigger picture
Worldometer summary of coronavirus cases worldwide
European Centre for Disease Prevention and Control info
https://www.ecdc.europa.eu/en/geographical-distribution-2019-ncov-cases
World Health Organisation info
Window on the USA
Centre for Disease Control (CDC)
American Association of Retired People (AARP)
Worcestershire
Help
http://www.worcestershire.gov.uk/here2help
Outbreak Control Plan
http://www.worcestershire.gov.uk/coronavirus
Miscellaneous
Spanish Flu
Dr Jeff Kildea's commentary about the 1919 outbreak of Spanish Flu in Australia
Views of Martin McKee, Professor of European Public Health
Follow Martin McKee on Twitter
SAGE membership
Scientific Advisory Group for Emergencies (SAGE)
Scottish government:
Link to Scottish Government website
Link to Postcode checker for COVID restrictions by protection level in areas of Scotland
Welsh Government:
Guidance on how you can keep safe during the outbreak and what rules are in place to protect people
![]()
The interpretations and opinions expressed are our own
Last updated 29th November 2020