Angus and Rosemary's Miscellany
of Malvern - Other Resources
|
Coronavirus (COVID-19) epidemic weekly update for Malvern SeniorsCOVID TIER 2 CONTROL MEASURES Skip to menu of archived pages T'is the Season to be Jolly Careful - says the Prime Minister PreambleWe keep an eye on the published government figures to asses the level of risk in the Malvern Hills district, if there is an uptick in cases we will tell you. This page is updated every Sunday between 1800 and 2400 hours GMT. Information about Coronavirus can be found on the NHS website: https://www.nhs.uk/coronavirus
|
 How
to request a test
How
to request a test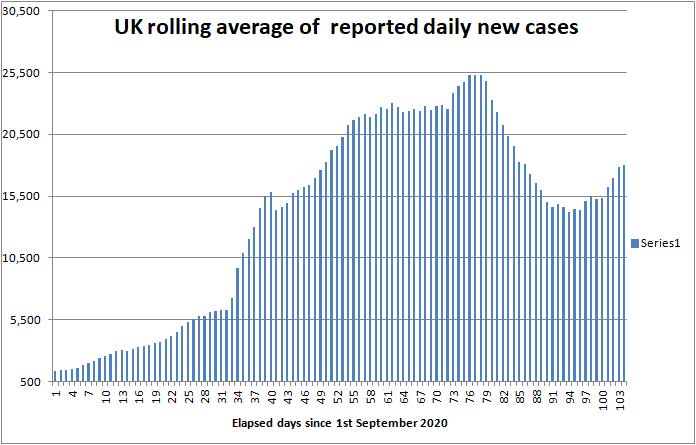
| Districts of Worcs | Cases | Weekly increase | Population |
| Bromsgrove | 2,559 | +163 | 98,529 |
| Malvern Hills | 1,012 | +42 | 77,545 |
| Redditch | 2,181 | +99 | 85,317 |
| Worcester | 2,003 | +55 | 103,542 |
| Wychavon | 2,047 | +112 | 126,240 |
| Wyre Forest | 2,234 | +128 | 100,957 |
| TOTAL | 12,036 | +566 | 592,130 |
| COMPARE WITH | |||
| County of Hereford | 2,650 | +88 | 195,000 |
| Leicester (city of) | 19,190 | +823 | 400,000 |
Cumulative cases reported by PHE in Worcestershire to 13th December 2020
At the bottom of the Coronavirus Dashboard (daily update) page there is an Interactive Map which is coloured to show the variation in infection rates across the country. This shows the level of infection across England reduced considerably during the second lockdown, but there is still more to do.
If you keep clicking the plus sign (+) to enlarge the map eventually you will see for example areas of Malvern, Guarlford and Madresfield; if you click each of these a box pops up which shows the number of cases in the last reported seven days, and a rolling average normalised to 100,000 population per week so rates can be compared across the country.
Note: the Interactive Map works on desktop PCs but you may encounter difficulties using a tablet or smartphone.
Click for Interactive Map of COVID cases
Recent weekly cases to 8th Dec show a marked reduction: Broadheath, Alfrick and Leigh Sinton 5; Pickersleigh 5; Upton and Welland 5; and less than 3 cases in each of the other areas of the town; the picture changes daily.
Number of deaths
Statistics on deaths are published by Public Health England, The Office of National Statistics, and NHS England.
PHE figures
Public Health England reports that the cumulative total of COVID (28) deaths in UK hospitals and care homes has risen by 2,925 in the last week to 64,170 while the rolling 7 day average has fallen slightly from 429 deaths per day to 418; in comparison averaged over recent years 1,700 people die daily from all causes.
The UK death rate may not fall as much as we had hoped during the remainder of December because of the unexpected upturn in daily new cases following the replacement of the second lockdown by the 'so called' strengthened tiers of restrictions.
Click to view the UK government Coronavirus Dashboard
ONS figures
The Office of National Statistics (ONS) separately reports registered deaths in England and Wales where COVID-19 is mentioned on the death certificate. The ONS figures lag the PHE figures by 10 - 14 days and do not include NI and Scotland, so are lower than the figures published by PHE.
The figures are broken down by District so one can glimpse where deaths are occurring. The cumulative total of COVID related deaths in Worcestershire reported by the ONS up to 27th November (week 48) is shown below.
| Districts of Worcs | Deaths | Weekly increase | Population |
| Bromsgrove | 139 | 0 | 98,529 |
| Malvern Hills | 53 | +3 | 77,545 |
| Redditch | 74 | +10 | 85,317 |
| Worcester | 76 | +5 | 103,542 |
| Wychavon | 130 | +7 | 126,240 |
| Wyre Forest | 136 | +3 | 100,957 |
| TOTAL | 608 | +28 | 592,130 |
Cumulative COVID deaths registered by ONS to 27th November 2020
In the week ending 27th November, there were 28 COVID related deaths in Worcestershire, the highest so far in the second wave of the epidemic, of which 4 were in a care home, 1 at home, 1 in a hospice and 20 in hospital.
In total in England and Wales 3,256 COVID related deaths were reported by ONS in the week to 27th November, an increase of 339 (11%) on the week before showing the death rate slowly continuing to rise. Of these 627 were in Care Homes, 187 at home, 38 in a Hospice and 2,376 in hospital. This week the highest number of hospital deaths (>19) by Lower Tier Local Authority were in the North, Midlands and South Wales:
Blackpool and Darwen 20, Kingston upon Hull 21, Stoke on Trent 22, County Durham 34, East Lindsey 28, Bolton 26, Manchester 34, Oldham 26, Wigan 33, Barnsley 44, Doncaster 33, Rotherham 27, Sheffield 26, Birmingham 50, Dudley 24, Sandwell 25, Bradford 28, Kirklees 29, Leeds 45, Wakefield 34, Rhondda Cynon Taf 26, Aneurin Bevin University Health Board 31, Cwm Taf Morgannwg University Health Board 43, Swansea Bay University Health Board 24.
The cumulative total of all COVID related deaths recorded by the ONS rose to 69,794.
Click for national ONS data on deaths (Excel spreadsheet)
NHS England figures
More recently in the seven days ending 12th December NHS England reported 15 deaths in Worcestershire hospitals; same as last week.
Click for NHS COVID-19 Daily Deaths
Healthcare numbers
The UK government Coronavirus Dashboard includes important information about COVID-19 patients currently in hospital.
| Hospital cases (UK) | Number | Weekly change |
| Patients in hospital | 16,531 | +1,975 |
| Patients on ventilation | 1,275 | +1 |
| Patients admitted daily | 1,444 | +242 |
Headline summary of patients in hospital as reported 13th December 2020
Although these headline figures are not updated regularly they are useful indicators and suggest after a period of flat-lining the trend in hospital admissions is now upwards, mirroring the recent increase in COVID positive tests.
Note: very sick COVID patients are said to arrive in hospital 7 to 10 days after first symptoms, and either die or are discharged 15 to 30 days after first symptoms in most cases. Hospital beds are occupied by suspected COVID patients, very sick COVID patients, and a few suffering from 'Long COVID' who may remain in hospital for much longer than 30 days.
Notes on projected figures
It appears hospitals are only admitting very sick COVID-19 patients, for example those with breathing difficulties, which is probably why Professor Peter Horby of Oxford University said on the Andrew Marr show that up to 20% of COVID patients in hospital could die.
If this is correct, the current admission rate of 1,686 new COVID patients per day points to up to 337 hospital deaths per day, to which must be added forecast COVID deaths in other settings such as Care Homes. Adding 25% for the latter suggests about 420 deaths per day can be expected soon after Christmas.
Statistician Sir David Spiegelhalter of Cambridge University speaking separately on BBC TV said that, using his rule of thumb, hospital admissions were likely to be about 10% of reported new cases, one week after symptoms; and deaths were likely to be about 2% of new cases, 2 to 3 weeks after that - which would point towards about 360 hospital deaths per day in the second half of December.
Empirically, we judge the daily death rate rolling average is broadly 1.9% of the 7 day rolling average of new cases delayed by 21 days.
During the second wave of the epidemic in September and October the numbers fitted a truncated exponential series which we used to forecast a week ahead. During November rates slowed - approximating more closely to an S shaped Logistic curve, but that no longer fits so to explain the trend we now postulate a third wave of the UK COVID epidemic started on or about the 1st December caused, for example, by increased mingling and Christmas shopping; this can be expected to be fuelled by students returning home and the government relaxing household restrictions over Christmas. In consequence an upturn in daily cases and deaths seems likely in January, which could lead to a third lockdown.
Forecast for the week ahead
Trends suggest that during the next seven days (up to 20th December) the cumulative total of new UK COVID-19 cases reported by PHE on the Coronavirus Dashboard can be expected to increase by about 140,000 towards 1,990,000 cases.
In Worcestershire up to 560 new cases of COVID-19 can be expected, and possibly up to 50 cases in the Malvern Hills district.
We estimate the number of COVID (28) deaths could increase by about 2,800 nationally towards 67,000 during the 7 days ending 20th December
In the county of Worcestershire, assuming a 2% death rate, the 566 new cases this week could translate to a maximum of 11 Worcestershire deaths per week in the latter half of December, but if cases are mostly confined to younger age groups it could be less.
Longer term forecast
Looking to the longer term using the 'rules of thumb' mentioned above, we now anticipate the national daily death rate won't decline much during December and will rise towards the end of the month (see commentary).
The chart below shows deaths to date in red and last week's projection of future COVID deaths up to the end of December in blue which assumed the death rate would fall progressively towards 200 deaths per day by the end of the year.
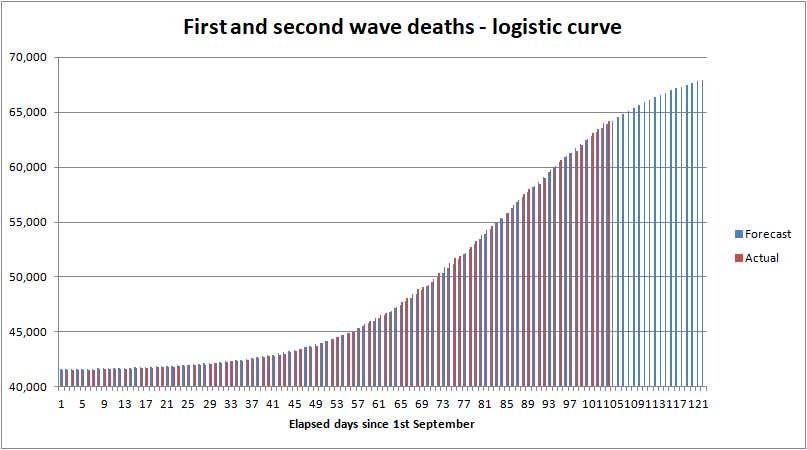
Last week's forecast of UK cumulative COVID deaths to 31st December
We now anticipate the UK COVID death rate won't dip much below 300 to 350 deaths per day during December before rising again in January. The effect of this will be that actual deaths will most likely begin topping the blue curve leading to perhaps 70,000 UK COVID deaths by the end of December 2020.
In those areas where the COVID death rate is highest, such as in the North of England and South Wales, the storing of bodies in temporary mortuaries and some delay to funeral services cannot be ruled out between now and the end of January; though this is unlikely to be the case in Worcestershire where the COVID death rate remains relatively low.
In order to explain the recent upturn in daily new cases we postulate a third wave of the COVID epidemic began on or around 1st December following the ending of second lockdown, which fuelled by further easing of restrictions over Christmas could lead to the death rate rising in January after a slight dip in December.
If mass testing does not keep the numbers under control, the government might feel inclined to impose a third lockdown, despite likely stiff opposition from business leaders and Conservative MPs.
Realistically, it may take until the summer to vaccinate 50% of the UK population, but Seniors should take heart that they are likely to be near the front of the queue.
Advice for Seniors
 Despite
COVID infections falling in Malvern town this week, pockets of
infection remain across Worcestershire, so we consider the risk still
to be MODERATE to HIGH for Seniors living in the
Malvern Hills district; see our annex and riskometer opposite.
Despite
COVID infections falling in Malvern town this week, pockets of
infection remain across Worcestershire, so we consider the risk still
to be MODERATE to HIGH for Seniors living in the
Malvern Hills district; see our annex and riskometer opposite.
If you are unlucky and catch COVID there is a significant chance that you will either die or your long term health may be seriously damaged, so take care to protect yourself and those you love. 90% of COVID deaths are in those aged over 60 years according to NHS England statistics.
Apart from relaxation of restrictions between 23rd and 27th December you should not mix with other households while Worcestershire is in tier 2.
Although the government will be easing restrictions over Christmas, risk averse Seniors should consider not mixing indoors in large family groups. Instead, perhaps consider inviting a lonely friend round for Christmas lunch and communicating with family using, for example, either Skype, Facetime or Zoom.
In any event, think carefully about what you are doing, who you are doing it with, and where you are mixing.
The simple safeguards to remember are still to:
-
wash your hands thoroughly, using soap and hot water, for 20 seconds, including after handling deliveries to your home (HANDS) see note 1;
-
wear a face mask when appropriate for example when shopping or visiting the chemist (FACE);
-
avoid mingling especially in crowded places, and continue with precautions such as physical distancing by 2 metres (SPACE) keeping proximity with others brief (TIME) see notes 2 and 3.
Hence the mantra:-
HANDS, FACE, SPACE, TIME - GET A TEST if you feel unwell.
Click for UK government Coronavirus guidance on what you can and cannot do
Remember, if you have symptoms of COVID-19 and can't count from one to ten out loud due to shortness of breath, you should immediately call your GP, 111 or 999 for advice.
Notes:
1) Wash your hands thoroughly before touching your face to avoid transferring virus from surfaces to your mouth, eyes and nose. If outdoors use hand gel.
2) Minimise time spent mixing with people outside your household in indoor settings - an invisible mist of virus can build up in the air if the space is shared with an infectious person; imagine people exhaling cigarette smoke. Unless you wear a hospital grade face mask you can breath this in; a face covering will offer little or no protection. The likelihood and extent you get sick will depend on the density of the airborne virus, which can be reduced by ventilation, and your exposure time.
3) Two metres is further than you think, and roughly an arm and a walking stick away - difficult to chat if the person you are talking to is hard of hearing!
Annex to 13th December update
Commentary
Media attention this week turned towards stalemate in the BREXIT negotiations, suggesting it was unlikely a trade deal would be struck with the EU before the New Year.
Sky News presenter Kay Burley was herself in the news for holding a 60th birthday party, allegedly breaching the COVID regulations, as was her colleague Beth Rigby who was a guest; both have been suspended.
The COVID vaccination programme using the Pfizer vaccine rolled out to a fanfare of press coverage on 8th December, but Seniors may have to wait until the New Year before vaccinations start in the Malvern Hills.
It has been announced the period of quarantine following possible exposure to COVID-19 will be reduced from 14 to 10 days.
There is some concern about infection transmitted by 11 - 18 year old pupils. Schools are being closed in Wales, whereas mass testing is being talked about in England, possibly in January.
The danger of mingling at Christmas
The relaxation of restrictions over Christmas will lead to more deaths and almost certainly a third wave of the epidemic. Last week we speculated that in the very worst case there could be up to 600,000 new cases of Coronavirus and 12,000 additional deaths.
The message seemed clear: the easing of restrictions over Christmas can be expected to lead to a third wave of the epidemic, a surge in hospital admissions in January and a significant number of unnecessary COVID deaths.
However looked at from another angle the majority of joyous family gatherings (>99%) would probably be infection free. So take your pick!
Our recommendation is that risk averse Seniors should consider declining Christmas gatherings this year, unless they have a life limiting condition and feel that this may be their last. That in itself would not stop a third wave of the epidemic but should reduce elderly hospital admissions and unnecessary deaths to < 1,000; a mere drop in the ocean compared to the number of past and expected COVID casualties!
Recent deaths in Worcestershire hospitals
The table below shows COVID deaths in Worcestershire Acute Hospitals Trust reported by NHS England to 12th December.
| Date | Number |
| 6th December | 2 |
| 7th December | 2 |
| 8th December | 2 |
| 9th December | 4 |
| 10th December | 3 |
| 11th December | 1 |
| 12th December | 0 |
| Total | 14 |
Worcester Acute Trust hospitals COVID deaths in 7 days to 12th December
In addition there was one death in a Worcester 'Care' hospital
To date a total of 379 COVID deaths have been reported in Worcester Acute hospitals and 33 in 'Care' hospitals.
Present rate of new cases
This week, the average rate of infection per 100,000 population per week in England rose from 150 to 166. In comparison the figure for Worcestershire fell to 91 and that in the Malvern Hills to 48; so the Malvern Hills remains the safest district in Worcestershire and compares well with the city of Leicester where the rate of infection is still five times higher.
Nevertheless Seniors should continue to be careful.
The probability of catching Coronavirus in the Malvern Hills is moderate, and continuing to fall but combined with the significant risk of death makes us view the overall risk to Seniors as MODERATE to HIGH.
The risk of death from Coronavirus for healthy teenagers is exceedingly small so for them the risk is LOW, whereas the middle aged can suffer from Long COVID so for them the risk might be assessed MODERATE.
Forecast of death rate during December
Last week we made a rough estimate of the future daily death rate - emphasising that while one can't go far wrong extrapolating a week ahead, forecasting the death rate one month ahead is little more than a shot in the dark.
Using an Excel spreadsheet, we fitted the actual death rate to an S shaped curve (or logistic function) and used that to project how the death rate might fall in December. We then added a further estimate based on 1.9% of the rolling average of new cases delayed 21 days - shaded green in the chart below.
Based on the reduction in daily cases during the second lockdown, and taking account of hospital admissions, we expect the death rate to begin dipping later next week towards 300 to 350 deaths per day and then rising.
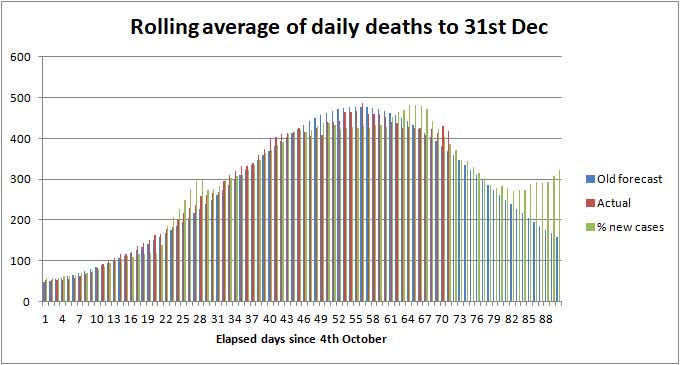
Illustration of possible death rate to 31st December
Modelling by the European Centre for Disease Control (ECDC) suggests relaxing COVID restrictions over Christmas could lead to the hospital admission rate rising by up to 50% during January, which in turn could lead to between 500 and 600 deaths per day, and imposition of a third lockdown.
Other projections of future COVID-19 total and daily deaths can be found on The Institute for Health Metrics and Evaluation website. IHME is an independent population health research centre which is part of the University of Washington School of Medicine in Seattle, in turn affiliated to the University of Washington. Here you will also find interesting projections for other countries such as Argentina where the per capita COVID casualties are similar to the UK, but the shape of the epidemic is quite different.
Click for IHME projection of COVID-19 deaths
Summary of Links
Symptoms
Article about the effects of Coronavirus on the human body
Reporting and how to obtain a test
How to get a test
https://www.nhs.uk/coronavirus
About joining the Zoe COVID Symptom Study:
Guidance
UK government Coronavirus guidance
Statistics
UK government Coronavirus Dashboard
Coronavirus Dashboard Interactive map
ONS data on deaths in England and Wales (Excel spreadsheet)
Snapshots of deaths in hospital in England. This is not consolidated, so best see the Coronavirus Dashboard to view trends.
Reports
National COVID-19 surveillance reports
ONS Coronavirus (COVID-19) roundup: Deaths and health
The bigger picture
Worldometer summary of coronavirus cases worldwide
European Centre for Disease Prevention and Control info
https://www.ecdc.europa.eu/en/geographical-distribution-2019-ncov-cases
World Health Organisation info
Window on the USA
Centre for Disease Control (CDC)
American Association of Retired People (AARP)
Worcestershire
Help
http://www.worcestershire.gov.uk/here2help
Outbreak Control Plan
http://www.worcestershire.gov.uk/coronavirus
Miscellaneous
Spanish Flu
Dr Jeff Kildea's commentary about the 1919 outbreak of Spanish Flu in Australia
Views of Martin McKee, Professor of European Public Health
Follow Martin McKee on Twitter
SAGE membership
Scientific Advisory Group for Emergencies (SAGE)
Scottish government:
Link to Scottish Government website
Link to Postcode checker for COVID restrictions by protection level in areas of Scotland
Welsh Government:
Guidance on how you can keep safe during the outbreak and what rules are in place to protect people
![]()
The interpretations and opinions expressed are our own
Last updated 14th December 2020