Angus and Rosemary's Miscellany
of Malvern - Other Resources
|
Coronavirus (COVID-19) epidemic weekly update for Malvern SeniorsCOVID TIER 2 CONTROL MEASURES Cases soaring nationally PM scraps easing of controls over Christmas Skip to menu of archived pages PreambleWe keep an eye on the published government figures to asses the level of risk in the Malvern Hills district, if there is an uptick in cases we will tell you. This page is updated every Sunday between 1800 and 2400 hours GMT. Information about Coronavirus can be found on the NHS website: https://www.nhs.uk/coronavirus
|
 How
to request a test
How
to request a test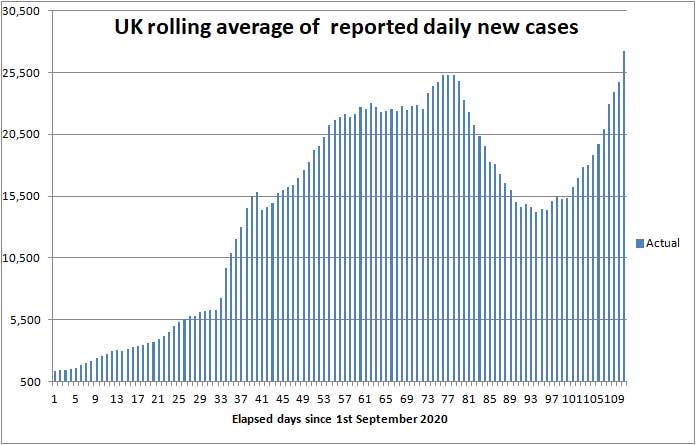
| Districts of Worcs | Cases | Weekly increase | Population |
| Bromsgrove | 2,802 | +243 | 98,529 |
| Malvern Hills | 1,083 | +71 | 77,545 |
| Redditch | 2,344 | +163 | 85,317 |
| Worcester | 2,106 | +103 | 103,542 |
| Wychavon | 2,252 | +205 | 126,240 |
| Wyre Forest | 2,387 | +153 | 100,957 |
| TOTAL | 12,974 | +938 | 592,130 |
| COMPARE WITH | |||
| County of Hereford | 2,849 | +199 | 195,000 |
| Leicester (city of) | 20,149 | +959 | 400,000 |
Cumulative cases reported by PHE in Worcestershire to 20th December 2020
The main point to note is the weekly figures are going up again despite Worcestershire being in TIER 2.
At the bottom of the Coronavirus Dashboard (daily update) page there is an Interactive Map which is coloured to show the variation in infection rates across the country. This shows the level of infection across England has soared this week (see purple patches).
If you keep clicking the plus sign (+) to enlarge the map eventually you will see for example areas of Malvern, Guarlford and Madresfield; if you click each of these a box pops up which shows the number of cases in the last reported seven days, and a rolling average normalised to 100,000 population per week so rates can be compared across the country.
Note: the Interactive Map works on desktop PCs but you may encounter difficulties using a tablet or smartphone.
Click for Interactive Map of COVID cases
Recent weekly cases to 15th December are: North Malvern 6; Malvern Link 5; Pickersleigh 5; Barnards Green 5; Upton and Welland 5; Callow End and Hanley 6; Upton and Welland 11. The picture changes daily.
Number of deaths
Statistics on deaths are published by Public Health England, The Office of National Statistics, and NHS England.
PHE figures
Public Health England reports that the cumulative total of COVID (28) deaths in UK hospitals and care homes has risen by 3,231 in the last week to 67,401 while the rolling 7 day average has risen from 418 deaths per day to 462. This is higher than we would have expected from historical daily new cases and hospital admissions, and we wonder whether this is a statistical blip or perhaps the newly emerging variant of COVID-19 mentioned by Matt Hancock is slightly more lethal (see commentary).
Click to view the UK government Coronavirus Dashboard
In comparison averaged over recent years 1,700 people die daily from all causes.
In those districts where the COVID death rate is highest the storing of bodies in temporary mortuaries and some delay to funeral services cannot be ruled out between now and the end of February; though this is unlikely to be the case in Worcestershire where the COVID death rate remains low.
ONS figures
The Office of National Statistics (ONS) separately reports registered deaths in England and Wales where COVID-19 is mentioned on the death certificate. The ONS figures lag the PHE figures by 10 - 14 days and do not include NI and Scotland, so are lower than the figures published by PHE.
The figures are broken down by District so one can glimpse where deaths are occurring. The cumulative total of COVID related deaths in Worcestershire reported by the ONS up to 4th December (week 49) is shown below.
| Districts of Worcs | Deaths | Weekly increase | Population |
| Bromsgrove | 143 | +4 | 98,529 |
| Malvern Hills | 53 | 0 | 77,545 |
| Redditch | 81 | +7 | 85,317 |
| Worcester | 78 | +2 | 103,542 |
| Wychavon | 135 | +5 | 126,240 |
| Wyre Forest | 146 | +10 | 100,957 |
| TOTAL | 636 | +28 | 592,130 |
Cumulative COVID deaths registered by ONS to 4th December 2020
In the week ending 4th December, there were 28 COVID related deaths in Worcestershire, of which 6 were in a care home, 1 in a hospice and 21 in hospital.
In total in England and Wales 3,024 COVID related deaths were reported by ONS in the week to 4th December, a fall of 232 (-7%) on the week before, suggesting the death rate may have levelled off. Of these 584 were in Care Homes, 119 at home, 26 in a Hospice and 2,278 in hospital; plus 20 elsewhere. The highest number of hospital deaths (>19) by Lower Tier Local Authority were in the North, Midlands and South Wales:
Kingston upon Hull 21, East Riding of Yorkshire 23, North Lincolnshire 22, Leicester 20, Stoke on Trent 31, Newcastle under Lyme 21, Manchester 20, Rochdale 20 Wigan 32, Barnsley 28, Rotherham 31, Sheffield 24, Birmingham 54, Dudley 20, Sandwell 21, Bradford 31, Kirklees 24, Leeds 46, Wakefield 22, Havering 22, Neath Port Talbot 21, Betsi Cadwaladr University Health Board 22, Aneurin Bevan University Health Board 38, Cwm Taf Morgannwg University Health Board 29, Swansea Bay University Health Board 39.
The cumulative total of all COVID related deaths recorded by the ONS rose to 72,522.
Click for national ONS data on deaths (Excel spreadsheet)
NHS England figures
More recently in the seven days ending 19th December NHS England reported 22 deaths in Worcestershire hospitals.
Click for NHS COVID-19 Daily Deaths
Healthcare numbers
The UK government Coronavirus Dashboard includes important information about COVID-19 patients currently in hospital.
| Hospital cases (UK) | Number | Weekly change |
| Patients in hospital | 18,771 | +2,240 |
| Patients on ventilation | 1,364 | +89 |
| Patients admitted daily | 2,034 | +590 |
Headline summary of patients in hospital as reported 20th December 2020
Although these headline figures are not updated regularly they are useful indicators and suggest after a period of flat-lining the trend in hospital admissions is now firmly upwards, mirroring the recent increase in COVID positive tests. The government hopes to keep a lid on hospital admissions by more testing and imposing a TIER 4 lockdown in those areas where new cases are soaring.
Note: very sick COVID patients are said to arrive in hospital 7 to 10 days after first symptoms, and either die or are discharged 15 to 30 days after first symptoms in most cases. Hospital beds are occupied by suspected COVID patients, very sick COVID patients, and a few suffering from 'Long COVID' who may remain in hospital for much longer than 30 days.
Notes on projected figures
It appears hospitals are only admitting very sick COVID-19 patients, for example those with breathing difficulties, which is probably why Professor Peter Horby of Oxford University said on the Andrew Marr show that up to 20% of COVID patients in hospital could die.
If this is correct, the current admission rate of 2,034 new COVID patients per day points to up to 412 hospital deaths per day, to which must be added forecast COVID deaths in other settings such as Care Homes. Adding 30% for the latter suggests about 535 deaths per day can be expected by the end of December/early January.
Statistician Sir David Spiegelhalter of Cambridge University speaking separately on BBC TV said that, using his rule of thumb, hospital admissions were likely to be about 10% of reported new cases, one week after symptoms; and deaths were likely to be about 2% of new cases, 2 to 3 weeks after that - which would point towards about 540 hospital deaths per day in the first half of January.
During the second wave of the epidemic in September and October the numbers fitted a truncated exponential series which we used to forecast a week ahead. During November rates slowed - approximating more closely to an S shaped Logistic curve, but that no longer fits so to explain the upward trend we now postulate a third wave of the UK COVID epidemic began on or about the 1st December caused, for example, by increased mixing and Christmas shopping; this can be expected to be fuelled by students returning home and mingling over Christmas. In consequence a rise in daily cases and deaths is likely in January.
Forecast for the week ahead
Trends suggest that during the next seven days (up to 27th December) the cumulative total of new UK COVID-19 cases reported by PHE on the Coronavirus Dashboard could increase by up to 230,000 towards 2,274,000 cases, but the increase may be less if the new TIER 4 control measures work.
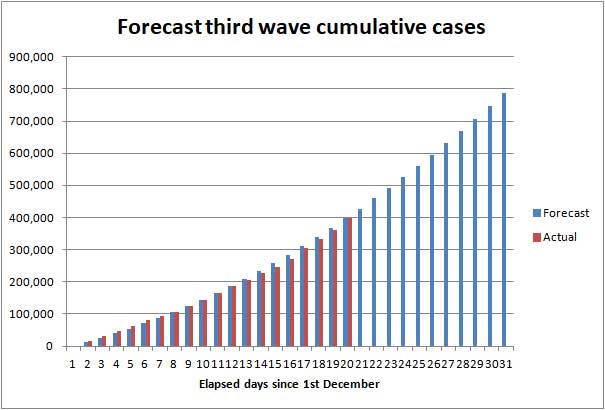
Illustration of possible rise in third wave cases to 31st December before TIER 4
In Worcestershire up to 1,000 new cases of COVID-19 can be expected, and possibly up to 100 cases in the Malvern Hills district.
We estimate the number of COVID (28) deaths could increase by about 3,500 nationally towards 70,900 during the 7 days ending 27th December
In the county of Worcestershire, assuming a 2% death rate, the 938 new cases this week could translate to a maximum of 18 Worcestershire deaths per week in early January, but if cases are mostly confined to younger age groups it could be less.
Longer term forecast
The chart below shows deaths to date reported by PHE in red and our old projection of future COVID deaths up to the end of December in blue which assumed the death rate would fall progressively towards 200 deaths per day by the end of the year. We now believe the tip of the blue curve to be an underestimate.
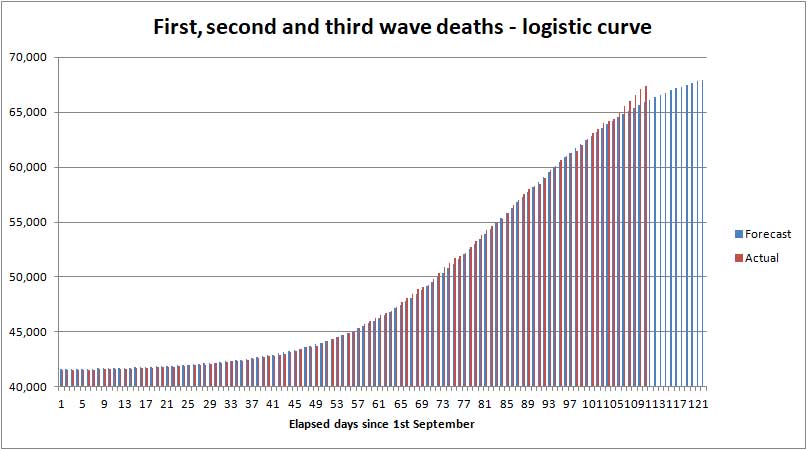
Old forecast of UK cumulative COVID deaths to 31st December
Using the 'rules of thumb' mentioned above we had anticipated the national daily death rate might actually dip to between 300 to 350 deaths per day during December assuming it mirrored the fall in reported daily cases during the second lockdown, and taking account of recent hospital admissions. However the running 7 day average of deaths has so far not dropped below 400 resulting in actual deaths topping the blue curve - so we now think the UK COVID death toll will rise to between 70,000 and 72,000 by the end of December 2020 (on the basis reported by PHE). To give a measure of scale, this exceeds all UK civilian deaths during WWII.
The third wave
For the purpose of simple analysis, we judge a third wave of the COVID epidemic began on or around 1st December, as the second lockdown drew to a close, perhaps sparked by about 130,000 carriers, which fuelled by mingling over Christmas could lead to the death rate rising in January; by how much is impossible to quantify as this may be reduced by the new TIER 4 control measures. However you can be sure the government will impose further restrictions if needed, such as a third lockdown, in an attempt to keep hospital daily admissions below about 2,000 and that in turn should keep the average daily death rate below 450 (assuming that the winter death rate is no higher than it was in the summer).
The UK COVID death toll will continue climbing in the new year until the vaccination programme eventually brings the epidemic to a close. In the meantime we anticipate the death toll could reach 100,000 by the end of March 2021; see commentary.
Exactly what happens will depend on the effectiveness of the government's tiered restrictions, public compliance, testing, any change in the lethality of emerging strains of the virus and the speed of the vaccine rollout.
Although it may take until the summer to vaccinate 50% of the UK population, Seniors should take heart that they should be near the front of the queue.
Advice for Seniors
 Coronavirus
is soaring in South Wales and SE England, while pockets of infection remain
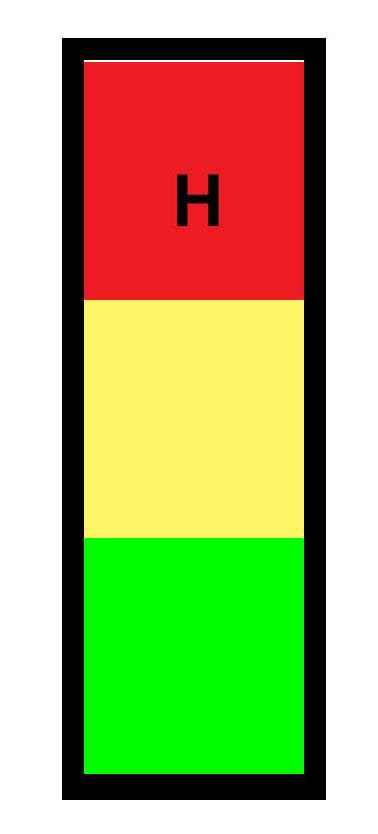
across Worcestershire, so we consider the risk to be HIGH for Seniors living in the
Malvern Hills district; see our annex and riskometer opposite.
Coronavirus
is soaring in South Wales and SE England, while pockets of infection remain
across Worcestershire, so we consider the risk to be HIGH for Seniors living in the
Malvern Hills district; see our annex and riskometer opposite.
If you are unlucky and catch COVID there is a significant chance that you will either die or your long term health may be seriously damaged, so take care to protect yourself and those you love. 90% of COVID deaths are in those aged over 60 years according to NHS England statistics.
Apart from relaxation of restrictions on Christmas Day you should not mix with other households.
Although the government will be easing restrictions on Christmas Day, risk averse Seniors should consider not mixing indoors in large family groups. Instead, perhaps consider inviting a lonely friend round for Christmas lunch and communicating with family using, for example, either Skype, Facetime or Zoom.
In any event, think carefully about what you are doing, who you are doing it with, and where you are mixing.
The simple safeguards to remember are still to:
-
wash your hands thoroughly, using soap and hot water, for 20 seconds, including after handling deliveries to your home (HANDS) see note 1;
-
wear a face mask when appropriate for example when shopping or visiting the chemist (FACE);
-
avoid mingling especially in crowded places, and continue with precautions such as physical distancing by 2 metres (SPACE) keeping proximity with others brief (TIME) see notes 2 and 3.
Hence the mantra:-
HANDS, FACE, SPACE, TIME - GET A TEST if you feel unwell.
Click for UK government Coronavirus guidance on what you can and cannot do
Remember, if you have symptoms of COVID-19 and can't count from one to ten out loud due to shortness of breath, you should immediately call your GP, 111 or 999 for advice.
Notes:
1) Wash your hands thoroughly before touching your face to avoid transferring virus from surfaces to your mouth, eyes and nose. If outdoors use hand gel.
2) Minimise time spent mixing with people outside your household in indoor settings - an invisible mist of virus can build up in the air if the space is shared with an infectious person; imagine people exhaling cigarette smoke. Unless you wear a hospital grade face mask you can breath this in; a face covering will offer little or no protection. The likelihood and extent you get sick will depend on the density of the airborne virus, which can be reduced by ventilation, and your exposure time.
3) Two metres is further than you think, and roughly an arm and a walking stick away - difficult to chat if the person you are talking to is hard of hearing!
Annex to 20th December update
Commentary
A crisis is looming with people tiring of the restrictions and a more infectious strain of COVID-19 emerging causing outbreaks of Coronavirus to flare up before the vaccination programme has had time to make a difference.
The priority now will be to keep a lid on the virus while rolling out vaccinations with all speed.
At Saturday afternoon's Number 10 COVID press conference the government executed a U turn scrapping COVID easing between 23rd and 27th December. Instead a bubble of up to three households can meet on Christmas Day in TIERS 1-3, but in most cases there should be no overnight stay.
Those regions moved up to TIER 3 on Thursday have been bumped up to a new TIER 4, a lockdown in all but name, with immediate effect. Those households must not invite others to join them at Christmas and must restrict travel so as not to spread the virus.
The Prime Minister said the new restrictions were necessary because of a new strain of COVID-19 which is spreading roughly 70% faster in London, East and South East England. Whether this is real or just an excuse for the U turn we don't know.
Earlier there had been frenzy of debate in the media about whether Christmas should be 'cancelled' in view of the rapid rise in infections in some regions. Warnings had been given of hospitals reaching capacity in Northern Ireland and South Wales, and ambulances arriving with patients for whom there were no beds.
Alarm bells began to ring loudly in England as new outbreaks of Coronavirus flared up in Kent creeping towards London.
By Saturday in Wales the devolved administration decided to limit gatherings to two households on Christmas Day only and put Wales into a third lockdown immediately. On 17th Dec it had been announced 11,000 cases of coronavirus had been omitted from previous figures due to a planned computer upgrade, and this had been added to the daily cases reported on 17th making the UK total unusually high.
Northern Ireland has announced a 6 week lockdown after Christmas due to pressure on hospitals.
Across Scotland, up to eight people from a maximum of three households will still be able to gather indoors on Christmas Day itself. However, no travel in or out of Scotland is allowed because a strict travel ban will be in place. All of mainland Scotland is to be put into a TIER 4 lockdown on Boxing Day.
In theory few large family gatherings can now take place. We'll have to wait and see what actually happens!
Changes to tiers
On 17th December Matt Hancock announced in Parliament that Herefordshire would be moved down into TIER 1. Worcestershire, where cases have recently begun rising, remains in TIER 2. Regions where the virus is now surging were moved into TIER 3. On Saturday these areas were bumped up into a new TIER 4 (lockdown).
Recent deaths in Worcestershire hospitals
The table below shows COVID deaths in Worcestershire Acute Hospitals Trust reported by NHS England to 19th December.
| Date | Number |
| 13th December | 5 |
| 14th December | 3 |
| 15th December | 4 |
| 16th December | 5 |
| 17th December | 4 |
| 18th December | 0 |
| 19th December | 0 |
| Total | 21 |
Worcester Acute Trust hospitals COVID deaths in 7 days to 19th December
In addition there was one death in a Worcester 'Care' hospital.
To date a total of 404 COVID deaths have been reported in Worcester Acute hospitals and 34 in 'Care' hospitals.
Present rate of new cases
This week, the average rate of infection per 100,000 population per week in England rose from 166 to 262. In comparison the figure for Worcestershire rose to 139 and that in the Malvern Hills to 61; the Malvern Hills remains the safest district in Worcestershire.
Nevertheless Seniors should continue to be careful.
The probability of catching Coronavirus in the Malvern Hills is moderate but increasing and combined with the significant risk of death makes us view the overall risk to Seniors this week as HIGH.
The risk of death from Coronavirus for healthy teenagers is exceedingly small so for them the risk is LOW, whereas the middle aged can suffer from Long COVID so for them the risk might be assessed MODERATE.
Forecast of death rate during the remainder of December and beyond
An indication of the future death rate can be obtained from daily hospital admissions.
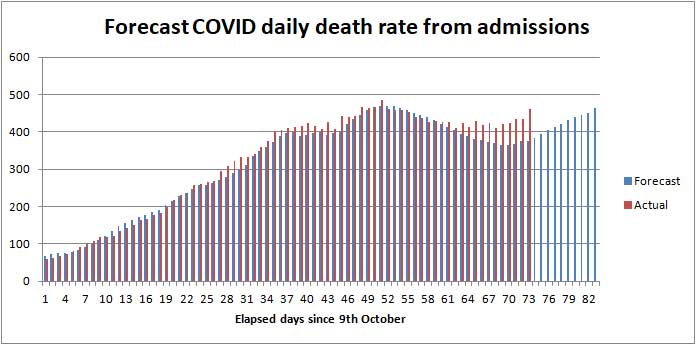
Forecast of daily death rate from hospital admissions
The chart above shows the actual daily death rate and the forecast death rate calculated as 20.8 % of hospital admissions, delayed by 10 days, multiplied by 1.3 for deaths in other settings such as care homes. You will see that correlation has been good over a period of 2 months but in the last few days actual deaths have been topping the forecast. As yet we have no explanation for this small difference but speculate that either sick people are delaying seeking help, the death rate is slightly higher in the winter, hospitals cannot give optimum care due to pressure of numbers, or the newly emerging strain of COVID-19 is more deadly; possibly the reason is a combination of these factors.
A week's greater notice of the trend in the daily death rate can be obtained by monitoring the daily rate of people testing COVID positive.
Modelling by the European Centre for Disease Control (ECDC) suggests relaxing COVID restrictions over Christmas could lead to the hospital admission rate rising by up to 50% during January, which in turn could lead to between 500 and 600 deaths per day, and imposition of even tighter controls such as a third lockdown.
Click for ECDC modelling report
Other projections of the future COVID-19 death toll and daily deaths can be found on The Institute for Health Metrics and Evaluation website. IHME is an independent population health research centre which is part of the University of Washington School of Medicine in Seattle, in turn affiliated to the University of Washington. Here you will also find interesting projections for other countries such as Argentina where the per capita COVID casualties are similar to the UK, but the shape of the epidemic is quite different.
Click for IHME projection of COVID-19 deaths
The IHME forecast suggests that the death toll in the UK from COVID in all settings could be heading towards 116,000 by the end of March 2021, when the epidemic might be tailing off, and the death rate falling below 100 deaths per day. We currently think that projection is 'not unreasonable'. Assuming the death rate averages 400 deaths per day until towards the end of January and then falls linearly to 1st April, a back of the envelope calculation suggests about 30,000 more deaths can be expected which when added to the present cumulative total implies the UK death toll on the basis recorded by PHE could easily reach 100,000 by the end of March 2021. Bearing in mind the ONS figures which record all deaths where COVID is mentioned on the death certificate are higher, then these estimates are in the same 'ball park'.
At the start of the epidemic in March the Chief Scientific Adviser, Sir Patrick Valance, suggested a death toll of 20,000 would be a good outcome; on the other hand, Professor Neil Ferguson of Imperial College warned in some scenarios the death toll might be 250,000; while in the very worst case assuming up to 1% of the UK population died the outcome could have been nearer 400,000 taking account of the build up of herd immunity.
So how well will we have done? When Sir Patrick Valance spoke off the top of his head there had been few deaths and he clearly did not want to 'scare the horses'. Professor Neil Ferguson was nearer the mark. Many will consider an outcome of the order of 100,000 deaths a fair result compared to huge numbers of people dying in a very short space of time, more being permanently disabled by Long COVID, and collapse of the NHS. On the other hand the cost of supporting the unemployed has been enormous. There can be no winners or losers, but there must be an inquiry to learn lessons for the future.
Summary of Links
Symptoms
Article about the effects of Coronavirus on the human body
Reporting and how to obtain a test
How to get a test
https://www.nhs.uk/coronavirus
About joining the Zoe COVID Symptom Study:
Guidance
UK government Coronavirus guidance
Statistics
UK government Coronavirus Dashboard
Coronavirus Dashboard Interactive map
ONS data on deaths in England and Wales (Excel spreadsheet)
Snapshots of deaths in hospital in England. This is not consolidated, so best see the Coronavirus Dashboard to view trends.
Reports
National COVID-19 surveillance reports
ONS Coronavirus (COVID-19) roundup: Deaths and health
The bigger picture
Worldometer summary of coronavirus cases worldwide
European Centre for Disease Prevention and Control info
https://www.ecdc.europa.eu/en/geographical-distribution-2019-ncov-cases
World Health Organisation info
Window on the USA
Centre for Disease Control (CDC)
American Association of Retired People (AARP)
Worcestershire
Help
http://www.worcestershire.gov.uk/here2help
Outbreak Control Plan
http://www.worcestershire.gov.uk/coronavirus
Miscellaneous
Spanish Flu
Dr Jeff Kildea's commentary about the 1919 outbreak of Spanish Flu in Australia
Views of Martin McKee, Professor of European Public Health
Follow Martin McKee on Twitter
SAGE membership
Scientific Advisory Group for Emergencies (SAGE)
Scottish government:
Link to Scottish Government website
Link to Postcode checker for COVID restrictions by protection level in areas of Scotland
Welsh Government:
Guidance on how you can keep safe during the outbreak and what rules are in place to protect people
![]()
The interpretations and opinions expressed are our own
Last updated 21st December 2020