Angus and Rosemary's Miscellany
of Malvern - Other Resources
|
Coronavirus (COVID-19) epidemic weekly update for Malvern SeniorsCOVID TIER 2 CONTROL MEASURES Cases rising nationally Skip to menu of archived pages PreambleWe keep an eye on the published government figures to asses the level of risk in the Malvern Hills district, if there is an uptick in cases we will tell you. This page is updated every Sunday between 1800 and 2400 hours GMT. Information about Coronavirus can be found on the NHS website: https://www.nhs.uk/coronavirus
|
 How
to request a test
How
to request a test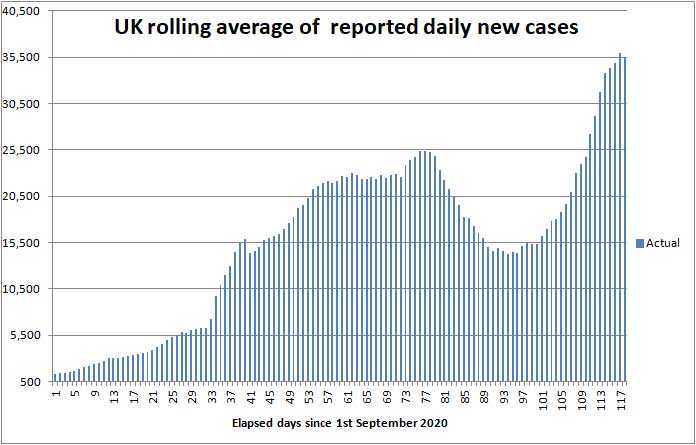
| Districts of Worcs | Cases | Weekly increase | Population |
| Bromsgrove | 3,094 | +292 | 98,529 |
| Malvern Hills | 1,188 | +105 | 77,545 |
| Redditch | 2,542 | +198 | 85,317 |
| Worcester | 2,313 | +207 | 103,542 |
| Wychavon | 2,543 | +291 | 126,240 |
| Wyre Forest | 2,599 | +212 | 100,957 |
| TOTAL | 14,279 | +1,305 | 592,130 |
| COMPARE WITH | |||
| County of Hereford | 3,185 | +336 | 195,000 |
| Leicester (city of) | 21,235 | +1,086 | 400,000 |
Cumulative cases reported by PHE in Worcestershire to 27th December 2020
The main point to note is the weekly figures are going up again so the tier 2 restrictions in Worcestershire are not working; hence the county could be moved into tier 3 at the next review on 30th December.
Interactive map
At the bottom of the Coronavirus Dashboard (daily update) page there is an Interactive Map which is coloured to show the variation in infection rates across the country. The region of highest infection in SE England (coloured purple on the map) has been growing rapidly; it now includes London, extending towards Cambridge and Ipswich in the north, Reading and Oxford in the West, Brighton to the south, and bounded by the coast to the east. Infection rates in South Wales are also continuing to soar.
If you keep clicking the plus sign (+) to enlarge the map eventually you will see for example areas of Malvern, Guarlford and Madresfield; if you click each of these a box pops up which shows the number of cases in the last reported seven days, and a rolling average normalised to 100,000 population per week so rates can be compared across the country.
Note: the Interactive Map works on desktop PCs but you may encounter difficulties using a tablet or smartphone.
Click for Interactive Map of COVID cases
Recent weekly cases to 22nd December are: North Malvern 5; Malvern Link 3; Pickersleigh 5; Barnards Green 7; Malvern Wells and Priory 3; Callow End and Hanley 5; Upton and Welland 15. The picture changes daily.
Number of deaths
Statistics on COVID deaths are published by Public Health England, The Office of National Statistics, and NHS England.
Jointly these figures indicate there was a small dip in the daily death rate around 10th December likely associated with the reduction of daily cases during the second lockdown in November. However the dip was less than we expected (see commentary).
PHE figures
Public Health England reports that the cumulative total of COVID (28) deaths in UK hospitals and care homes has risen by 3,351 in the last week to 70,752 while the rolling 7 day average rose from 462 deaths per day last Sunday to 522 on Christmas day (some data still to add).
Click to view the UK government Coronavirus Dashboard
In comparison averaged over recent years 1,700 people die daily from all causes.
In those districts where the COVID death rate is highest the storing of bodies in temporary mortuaries and some delay to funeral services cannot be ruled out between now and the end of February; this is most unlikely to be the case in Worcestershire where the COVID death rate is low.
ONS figures
The Office of National Statistics (ONS) separately reports registered deaths in England and Wales where COVID-19 is mentioned on the death certificate. The ONS figures lag the PHE figures by 10 - 14 days and do not include NI and Scotland, so are lower than the figures published by PHE.
The value of the ONS figures is that they are broken down by District so one can glimpse where deaths are occurring. The cumulative total of COVID related deaths in Worcestershire reported by the ONS up to 11th December (week 50) when the national death rate was approaching a minimum is shown below.
| Districts of Worcs | Deaths | Weekly increase | Population |
| Bromsgrove | 143 | +3 | 98,529 |
| Malvern Hills | 54 | +1 | 77,545 |
| Redditch | 86 | +5 | 85,317 |
| Worcester | 79 | +1 | 103,542 |
| Wychavon | 141 | +6 | 126,240 |
| Wyre Forest | 152 | +6 | 100,957 |
| TOTAL | 658 | +22 | 592,130 |
Cumulative COVID deaths registered by ONS to 11th December 2020
In the week ending 11th December, there were 22 COVID related deaths in Worcestershire, of which 3 were in a care home and 19 in hospital.
In total in England and Wales 2,976 COVID related deaths were reported by ONS in the week to 11th December, a slight fall of 48 (-1.6%) on the week before. Of these 576 were in Care Homes, 136 at home, 39 in a Hospice and 2,199 in hospital; plus 26 elsewhere.
The highest number of hospital deaths (>19) by Lower Tier Local Authority were in the North, Midlands, Lincolnshire, Kent and South Wales:
Stoke on Trent 30, Medway (Kent) 30, East Lindsey (Lincolnshire) 23, Oldham 20, Wigan 24, Barnsley 20, Sheffield 21, Birmingham 53, Dudley 20, Sandwell 27, Bradford 27, Kirklees 26, Leeds 34, Wakefield 26, Havering 21, Carmarthenshire 20, Swansea 22, Hywel Dda University Health Board 23, Aneurin Bevan University Health Board 36, Cwm Taf Morgannwg University Health Board 25, Swansea Bay University Health Board 38.
The cumulative total of all COVID related deaths recorded by the ONS rose to 75,807.
Click for national ONS data on deaths (Excel spreadsheet)
NHS England figures
More recently in the seven days ending 26th December NHS England reported just 10 deaths in Worcestershire hospitals compared to 22 last week, correlating with the dip in daily cases earlier in December.
Click for NHS COVID-19 Daily Deaths
Healthcare numbers
The UK government Coronavirus Dashboard includes important information about COVID-19 patients currently in hospital.
| Hospital cases (UK) | Number | Weekly change |
| Patients in hospital | 21286 | +2,515 |
| Patients on ventilation | 1,529 | +165 |
| Patients admitted daily | 2,143 | +109 |
Headline summary of patients in hospital as reported 27th December 2020
Although these headline figures are not updated regularly they are useful indicators and indicate the trend in hospital admissions is still upwards, in line with the increase in COVID positive tests.
After Christmas there have been reports of ambulance services and hospitals coming under increased strain, and there has been renewed talk of bringing the Nightingale Hospitals into play.
Doctor Al an A and E consultant in Manchester and a regular contributor on Stephen Nolan's late night programme on Radio 5, speaking last night about the pressures in his hospital sounded unusually stressed.
Figures for bed occupancy in Worcestershire hospitals can be found on the NHS England website:
Click for NHS England COVID-19 Hospital Activity
Note: very sick COVID patients are said to arrive in hospital 7 to 10 days after first symptoms, and either die or are discharged 15 to 30 days after first symptoms in most cases. Hospital beds are occupied by suspected COVID patients, very sick COVID patients, and a few suffering from 'Long COVID' who may remain in hospital for much longer than 30 days.
Notes on projected figures
It appears hospitals are only admitting very sick COVID-19 patients, for example those with breathing difficulties, which is probably why Professor Peter Horby of Oxford University said on the Andrew Marr show that up to 20% of COVID patients in hospital could die.
If this is correct, the current admission rate of 2,143 new COVID patients per day points to up to 428 hospital deaths per day, to which must be added forecast COVID deaths in other settings such as Care Homes. Adding 30% for the latter suggests there could be about 550 deaths per day in the first half of January.
Statistician Sir David Spiegelhalter of Cambridge University speaking separately on BBC TV said that, using his rule of thumb, hospital admissions were likely to be about 10% of reported new cases, one week after symptoms; and deaths were likely to be about 2% of new cases, 2 to 3 weeks after that - which points towards 700 hospital deaths per day in the second half of January.
During the early days of the second wave of the epidemic in September and October the numbers fitted a truncated exponential series which we used to forecast a week ahead. During November rates slowed - approximating more closely to an S shaped Logistic curve. Since then there has been an upturn in new daily cases which we attribute to a third wave of the UK COVID epidemic starting on 1st December caused by increased mixing after the end of the second lockdown, Christmas shopping, students returning home, households mixing on Christmas Day, and perhaps 10% of people flouting the restrictions.
Forecast for the week ahead
Trends suggest that during the next seven days (up to 3rd January) the cumulative total of new UK COVID-19 cases reported by PHE on the Coronavirus Dashboard may increase by between 270,000 and 335,000 towards 2,6250,000 cases, but the increase could be less if the new TIER 4 restrictions are effective.
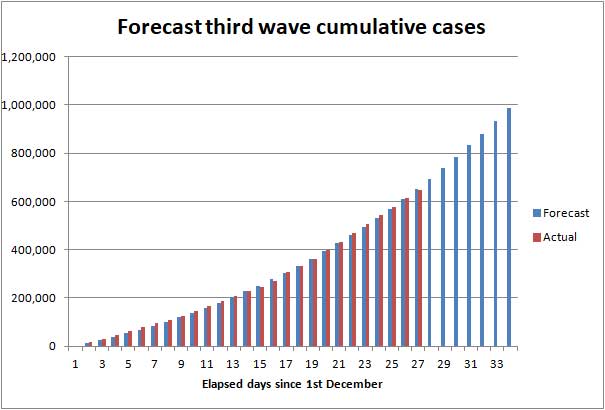
Illustration of possible rise in third wave cases to 3rd January before TIER 4
In Worcestershire up to 1,400 new cases of COVID-19 can be expected, and possibly up to 110 cases in the Malvern Hills district.
We estimate the number of COVID (28) deaths could increase by about 3,500 nationally towards 74,250 during the 7 days ending 3rd January 2021.
In the county of Worcestershire, assuming a 2% death rate, the 1,305 new cases this week could translate to a maximum of 26 Worcestershire deaths per week in the second half of January, but if cases are mostly confined to younger age groups it could be less.
Longer term forecast
The third wave of the COVID-19 epidemic in the UK
For the purpose of simple analysis, we asssume a third wave of the COVID-19 epidemic began on or around 1st December, as the second lockdown drew to a close, which could have been sparked by as few as 130,000 carriers (0.2% of the population); see chart above where the forecast is calculated as a truncated exponential series.
The present gentle acceleration in new daily cases could be fuelled by mingling over Christmas leading to an increase in hospital admissions and the death rate slowly rising during January; by how much is impossible to quantify as the extent ought to be reduced by the new TIER 4 control measures.
In theory the tiered restrictions could eventually cause daily cases and deaths to decline. If not, the government will almost certainly impose a third lockdown in an attempt to limit hospital admissions to below 2,000 per day and that in turn should keep the daily death rate, expressed as a 7 day rolling average, below 500 (assuming that the winter death rate is no higher than it was in the summer).
Nevertheless the UK COVID death toll will continue climbing in the New Year until the vaccination programme eventually brings the epidemic to a close. We anticipate the UK COVID death toll could reach 100,000 by the end of March 2021; see commentary.
Exactly what happens will depend on the effectiveness of the government's tiered restrictions, public compliance, the effectiveness of test and trace, any change in the lethality of emerging strains of the virus, and most importantly the speed of the vaccine rollout.
Vaccines
Approval of the Pfizer vaccine for use in the UK was announced on 2nd December and the first jabs were given in Coventry on 8th December. The government has ordered 40 million doses enough for 20 million people, but there has been no announcement about when the bulk of the vaccine will be delivered.
So far there has been little sign of the rollout of any COVID vaccine in the Malvern Hills and no official timetable has been promulgated - but do tell us if you know different.
A speculative article outlining the priority list for the Pfizer vaccine - and how it might be rolled out during coming months was published in the Daily Telegraph on 24th December:
Click for Daily Telegraph report on priorities for rollout of the vaccine
This suggests to us that the majority of 80+ year olds could start getting the vaccine in January, with a progressive rollout to younger Seniors in February and March.
It was reported in the weekend newspapers that the Oxford-Astrazeneca vaccine was likely to be approved in the next few days. The government has ordered 100 million doses enough for 50 million people. According to the Sunday Telegraph, distribution of the vaccines could begin as early as 4 January with the government hoping that more than two million people could have their first dose within the first two weeks.
We'll have to wait and see what happens - the government has a track record of not delivering on time.
Advice for Seniors
 Coronavirus
is soaring in South Wales and SE England, and daily cases are rising in
Worcestershire, so we consider the risk to remain HIGH
for Seniors living in the
Malvern Hills district; see our annex and riskometer opposite.
Coronavirus
is soaring in South Wales and SE England, and daily cases are rising in
Worcestershire, so we consider the risk to remain HIGH
for Seniors living in the
Malvern Hills district; see our annex and riskometer opposite.
If you are unlucky and catch COVID there is a significant chance that you will either die or your long term health may be seriously damaged, so take care to protect yourself and those you love. 90% of COVID deaths are in those aged over 60 years according to NHS England statistics.
The simple safeguards to remember are still to:
-
wash your hands thoroughly, using soap and hot water, for 20 seconds, including after handling deliveries to your home (HANDS) see note 1;
-
wear a face mask when appropriate for example when shopping or visiting the chemist (FACE);
-
avoid mingling especially in crowded places, and continue with precautions such as physical distancing by 2 metres (SPACE) keeping proximity with others brief (TIME) see notes 2 and 3.
-
self-isolate and book a test if you have COVID-19 symptoms (new continuous cough, fever or loss of, or change in, sense of smell or taste)
Hence the mantra:-
HANDS, FACE, SPACE, TIME - GET A TEST if you feel unwell.
Click for UK government Coronavirus guidance on what you can and cannot do
Remember, if you have symptoms of COVID-19 and can't count from one to ten out loud due to shortness of breath, you should immediately call your GP, 111 or 999 for advice.
Notes:
1) Wash your hands thoroughly before touching your face to avoid transferring virus from surfaces to your mouth, eyes and nose. If outdoors use hand gel.
2) Minimise time spent mixing with people outside your household in indoor settings - an invisible mist of virus can build up in the air if the space is shared with an infectious person; imagine people exhaling cigarette smoke. Unless you wear a hospital grade face mask you can breath this in; a face covering will offer little or no protection. The likelihood and extent you get sick will depend on the density of the airborne virus, which can be reduced by ventilation, and your exposure time.
3) Two metres is further than you think, and roughly an arm and a walking stick away - difficult to chat if the person you are talking to is hard of hearing!
Annex to 27th December update
Commentary
The UK government has the difficult task of attempting to keep the economy going while keeping a lid on the virus and vaccinating the population.
During the first lockdown which started on 23rd March, there was little testing so not much was known about the spread of the virus in the population and deaths would have been pretty much baked in.
We are now in the third wave of the epidemic; what is different is that better testing and computer databases allow the spread of COVID to be tracked, treatment is a little better, and vaccines are almost ready to be rolled out.
But there is a new variant of the virus which is said to be more infectious and it is thought one in three people with the disease show no symptoms who could be spreaders. This together with unknown numbers of people flouting the restrictions could be the cause of the third wave of COVID-19 which is currently spreading out of control in South East England and South Wales.
The daily death rate which has roughly flat-lined for six weeks shows signs of rising above 500 deaths per day in January, possibly briefly heading towards the peak reached in the first wave of the epidemic.
The government is clearly hoping that their tiered restrictions will stabilise the situation, but if that doesn't work a third lockdown seems inevitable.
One of the problems with the tiered controls is that an increasing number of people, presumably belonging to the 'rules are for others brigade', are flouting the restrictions so the control measures don't work very well. Mask wearing, for example, is erratic and not enforced, and people have been travelling from high tier into lower tier areas to shop and exercise, and staying overnight when they shouldn't. In comparison, during the foot and mouth outbreak the movement of animals was strictly controlled.
It has been suggested COVID is being spread by teenage school children but we have heard no reports of that being a significant problem in Malvern.
In Singapore, where people do what they are told, the epidemic is currently under control and there have been only 29 deaths.
In Australia, which has about half the population of the UK and where the restrictions are enforced, there have been just 28,337 cases and only 909 deaths. A friend in Brisbane relates:
Borders continue to open and shut and travel restrictions vary from week to week, depending on where the hotspots are, so you never know what you can do or can’t do; you just play it by ear. It has worked however and except for one bad outbreak in Victoria, Australia has remained relatively COVID-19 free. Queensland has now had over 100 days with no local transmissions and in total we have had only 6 deaths. We still have restrictions however but they are really limited and don’t effect life much unless you want to travel.
It may be unreasonable to compare countries with different climates and population densities, but perhaps there are lessons to be learnt.
Changes to tiers
Because of the exponential spread of the third wave of the virus in some places, more districts were placed into TIER 4 (a lockdown in all but name) on Boxing Day; the next planned review of the tiers will be on 30th December.
Recent deaths in Worcestershire hospitals
The table below shows COVID deaths in Worcestershire Acute Hospitals Trust reported by NHS England to 26th December.
| Date | Number |
| 20th December | 2 |
| 21st December | 2 |
| 22nd December | 2 |
| 23rd December | 1 |
| 24th December | 2 |
| 25th December | 0 |
| 26th December | 0 |
| Total | 9 |
Worcester Acute Trust hospitals COVID deaths in 7 days to 26th December
In addition there was 1 death in a Worcester 'Care' hospital.
The dip in deaths mirrors the fall in daily new cases during the second lockdown. Since then daily cases have risen to previous levels, suggesting the weekly number of Worcestershire deaths will return to about 22 by the middle of January.
To date a total of 417 COVID deaths have been reported in Worcester Acute hospitals and 39 in 'Care' hospitals.
Present rate of new cases
This week, the average rate of infection per 100,000 population per week in England rose from 262 to 392 indicating the epidemic is out of control. In comparison the figure for Worcestershire is 204 and that in the Malvern Hills 105; the rural Malvern Hills remains the safest district in Worcestershire.
As a guide one might expect the infection rate to be no more than 50 cases per 100,000 per week at this point of the epidemic; so it is hugely disappointing that, after 10 months of management by the government, the the national infection rate is eight times higher.
Seniors should continue to be careful.
The probability of catching Coronavirus in the Malvern Hills is moderate but increasing, and combined with the significant risk of death makes us view the overall risk to Seniors this week as HIGH.
The risk of death from Coronavirus for healthy teenagers is exceedingly small so for them the risk is LOW, whereas the middle aged can suffer from Long COVID so for them the risk might be assessed MODERATE.
Forecast of death rate during January and beyond
Deaths in the first half of January are already baked in and the daily death rate may creep from 500 towards 700 deaths per day. If the tiered restrictions successsfully reduce the number of daily new cases the death rate could start falling towards the end of January. Then the rollout of the vaccine could start to reduce deaths further in February.
A projection of the future COVID-19 death toll and daily deaths can be found on The Institute for Health Metrics and Evaluation website. IHME is an independent population health research centre which is part of the University of Washington School of Medicine in Seattle, in turn affiliated to the University of Washington. Here you will also find interesting projections for other countries such as Argentina where the per capita COVID casualties are similar to the UK, but the shape of the epidemic is quite different.
Click for IHME projection of COVID-19 deaths
The IHME forecast suggests that the death toll in the UK from COVID in all settings could be heading towards 116,000 by the end of March 2021, when the epidemic might be tailing off, and the death rate falling below 100 deaths per day. We currently think that projection is 'not unreasonable'. Assuming the death rate averages just 400 deaths per day until towards the end of January and then falls linearly to 1st April, a back of the envelope calculation suggests about 30,000 more deaths can be expected which when added to the present cumulative total implies the UK death toll, on the basis recorded by PHE, could easily reach 100,000 by the end of March 2021. Bearing in mind the ONS figures which record all deaths where COVID is mentioned on the death certificate are higher, then these estimates are in the same 'ball park'.
At the start of the epidemic in March the Chief Scientific Adviser, Sir Patrick Valance, suggested a death toll of 20,000 would be a good outcome; on the other hand, Professor Neil Ferguson of Imperial College warned in some scenarios the death toll might be as high as 250,000; while we thought, in the very worst case assuming up to 1% of the UK population died the outcome might have been nearer 400,000 taking into account some build up of herd immunity.
So how well will the UK have done? When Sir Patrick Valance spoke off the top of his head there had been few deaths and he clearly did not want to 'scare the horses'. Professor Neil Ferguson was nearest the mark. Some will consider an outcome of the order of 100,000 deaths a fair result compared to huge numbers of people dying in a very short space of time, more being permanently disabled by Long COVID, and collapse of the NHS. Others will say the UK has done poorly compared to the best performing countries such as Singapore where deaths have been much lower, never mind the enoumous expense of supporting those out of work and damage to the economy.
Ultimately there can be no winners or losers, but there must be a meaningful inquiry to learn lessons for the future.
Summary of Links
Symptoms
Article about the effects of Coronavirus on the human body
Reporting and how to obtain a test
How to get a test
https://www.nhs.uk/coronavirus
About joining the Zoe COVID Symptom Study:
Guidance
UK government Coronavirus guidance
Tiers
Guidance on tiers: what you need to know
Government postcode checker to find tier for other areas
Statistics
UK government Coronavirus Dashboard
Coronavirus Dashboard Interactive Map
ONS data on deaths in England and Wales (Excel spreadsheet)
NHS England COVID-19 Daily Deaths
NHS England COVID-19 Hospital Admissions
Reports
ONS Coronavirus (COVID-19) Roundup
The bigger picture
Worldometer summary of coronavirus cases worldwide
European Centre for Disease Prevention and Control info
https://www.ecdc.europa.eu/en/geographical-distribution-2019-ncov-cases
World Health Organisation info
Window on the USA
Centre for Disease Control (CDC)
American Association of Retired People (AARP)
Worcestershire
Help:
http://www.worcestershire.gov.uk/here2help
Worcestershire County Council COVID-19 information:
http://www.worcestershire.gov.uk/coronavirus
Here you will find a useful link,
'Website: Number of new cases by date in Worcestershire'
which displays interesting COVID charts and statistics for Worcestershire
Miscellaneous
Spanish Flu
Dr Jeff Kildea's commentary about the 1919 outbreak of Spanish Flu in Australia
Views of Martin McKee, Professor of European Public Health
Follow Martin McKee on Twitter
SAGE membership
Scientific Advisory Group for Emergencies (SAGE)
Scottish government:
Link to Scottish Government website
Link to Postcode checker for COVID restrictions by protection level in areas of Scotland
Welsh Government:
Guidance on COVID alert levels in Wales
![]()
The interpretations and opinions expressed are our own
Last updated 27th December 2020