Angus and Rosemary's Miscellany
of Malvern - Other Resources
|
Coronavirus (COVID-19) epidemic weekly update for Malvern SeniorsCOVID LOCKDOWN in ENGLAND Alert Level raised to 5 on January 4th Cases rising steeply PM says 'STAY AT HOME' Skip to menu of archived pages PreambleWe keep an eye on the published government figures to asses the level of risk in the Malvern Hills district, if there is an uptick in cases we will tell you. This page is updated every Sunday between 1800 and 2400 hours GMT. Information about Coronavirus can be found on the NHS website: https://www.nhs.uk/coronavirus
|
 How
to request a test
How
to request a test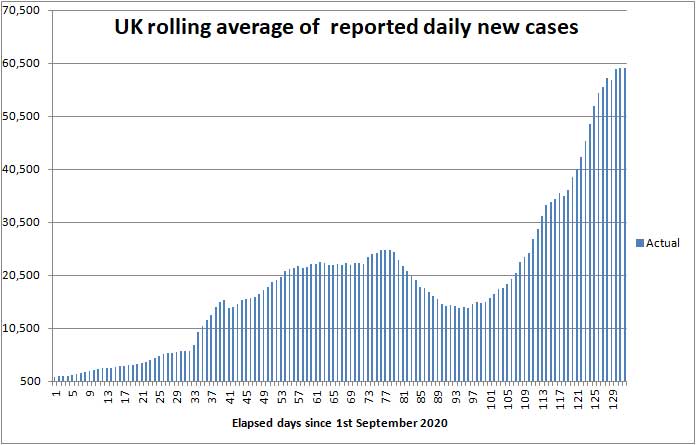
| Districts of Worcs | Cases | Weekly increase | Population |
| Bromsgrove | 4,256 | +713 | 98,529 |
| Malvern Hills | 1,613 | +252 | 77,545 |
| Redditch | 3,427 | +510 | 85,317 |
| Worcester | 3,522 | +782 | 103,542 |
| Wychavon | 3,646 | +698 | 126,240 |
| Wyre Forest | 3,485 | +473 | 100,957 |
| TOTAL | 19,949 | +3,428 | 592,130 |
| COMPARE WITH | |||
| County of Hereford | 4.495 | +705 | 195,000 |
| Leicester (city of) | 24,983 | +2,125 | 400,000 |
Cumulative cases reported by PHE in Worcestershire to 10th January 2021
Interactive map
At the bottom of the Coronavirus Dashboard (daily update) page there is an Interactive Map which is coloured to show the variation in infection rate across the country. The increasingly large purple patches show the areas of highest infection spreading across England, NI, and South Wales.
Click for Interactive Map of COVID cases
Note: the Interactive Map works on desktop PCs but it's possible you may encounter difficulties using a tablet or smartphone.
Recent weekly cases to 5th January are: North Malvern 24; Malvern Link 9; Pickersleigh 7; Barnards Green 21; Malvern Wells and Priory 15; Callow End and Hanley 34; Upton and Welland 26. The picture changes daily.
Number of deaths
Statistics on COVID deaths are published by Public Health England, The Office of National Statistics, and NHS England.
PHE figures
Public Health England reports that the cumulative total of COVID (28) deaths in UK hospitals and care homes has risen by 6,407 in the last week to 81,431 while the daily average has risen steeply from 610 on Christmas day to 915; see chart below.
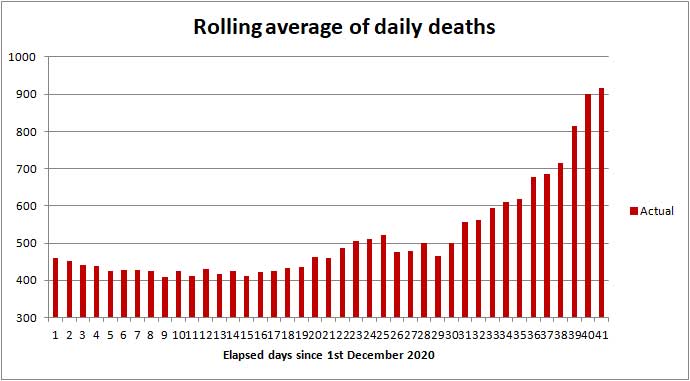
Daily UK death rate from 1st Dec to 10th Jan 2021 (source PHE)
Click to view the UK government Coronavirus Dashboard
In comparison averaged over recent years 1,700 people die daily from all causes.
In those districts where the COVID death rate is highest the storing of bodies in temporary mortuaries and delay to funeral services can be expected between now and the end of February.
ONS figures
The Office of National Statistics (ONS) separately reports registered deaths in England and Wales where COVID-19 is mentioned on the death certificate. The ONS figures lag the PHE figures by 10 - 14 days and do not include NI and Scotland, so are lower than the figures published by PHE.
The value of the ONS figures is that they are broken down by District so one can glimpse where deaths are occurring. The cumulative total of COVID related deaths in Worcestershire reported by the ONS up to 25th December (week 52) is shown below.
| Districts of Worcs | Deaths | Weekly increase | Population |
| Bromsgrove | 157 | +2 | 98,529 |
| Malvern Hills | 58 | +3 | 77,545 |
| Redditch | 101 | +5 | 85,317 |
| Worcester | 85 | +4 | 103,542 |
| Wychavon | 152 | +4 | 126,240 |
| Wyre Forest | 163 | +4 | 100,957 |
| TOTAL | 716 | +22 | 592,130 |
Cumulative COVID deaths registered by ONS to 25th December 2020
In the week ending 25th December, there were just 22 COVID related deaths in Worcestershire, of which 3 were in a care home, 1 at home, and 18 in hospital.
In total in England and Wales 3,187 COVID related deaths were reported by ONS in the week to 25th December, a small drop of 54 (2%) on the week before. Of these 568 were in care homes, 148 at home, 36 in a hospice and 2,410 in hospital; plus 25 elsewhere.
The highest number of hospital deaths (>19) by Lower Tier Local Authority were in Outer London, Birmingham and South Wales:
Stoke on Trent 23, Medway (Kent) 24, County Durham 23, Barnsley 23, Birmingham 40, Leeds 20, Havering (outer London) 34, Swansea 25, Rhondda Cynon Taf 30, Hywel Dda University Health Board 29, Aneurin Bevan University Health Board 52, Cardiff and Vale University Health Board 29, Cwm Taf Morgannwg University Health Board 44, Swansea Bay University Health Board 49.
The cumulative total of all COVID related deaths recorded by the ONS for all weeks of the epidemic rose to 82,235 of which 21,071 were in care homes; 3,947 at home; 1,056 in a hospice; 55,522 in hospital; and 639 elsewhere.
Click for national ONS data on deaths (Excel spreadsheet)
NHS England figures
More recently in the seven days ending 9th January NHS England reported the cumulative total of deaths in Worcestershire hospitals rose by 29 to 517.
Click for NHS COVID-19 Daily Deaths
Healthcare numbers
The UK government Coronavirus Dashboard includes important information about COVID-19 patients currently in hospital.
| Hospital cases (UK) | Number | Weekly change |
| Patients in hospital | 32,294 | +8,471 |
| Patients on ventilation | 3,098 | +1,251 |
| Patients admitted daily | 4,066 | +1,632 |
Headline summary of patients in hospital as reported 10th January 2021
These headline figures show the trend in hospital admissions is now disturbingly upwards, in line with the steep increase in COVID positive tests. Daily admissions greatly exceed the threshold of 2,000 above which hospitals could become overwhelmed.
Figures for bed occupancy in Worcestershire hospitals can be found on the NHS England website:
Click for NHS England COVID-19 Hospital Activity
On 5th January there were 174 COVID patients occupying beds in Worcestershire Acute Hospitals at Worcester, Kidderminster and Redditch, and a further 50 in 'care' hospitals. In England a total of 26,247 beds were occupied an increase of 50% since Christmas Day.
Note: The Welsh First Minister said some time ago that very sick COVID patients arrive in hospital 7 to 10 days after first symptoms, and either die or are discharged 15 to 30 days after first symptoms in most cases. Hospital beds are occupied by suspected COVID patients, very sick COVID patients, and a few suffering from 'Long COVID' who may remain in hospital for much longer than 30 days.
Notes on projected figures
It appears hospitals are only admitting very sick COVID-19 patients, for example those with breathing difficulties, which is probably why Professor Peter Horby of Oxford University said on the Andrew Marr show that up to 20% of COVID patients in hospital could die.
It is our observation that the death rate as a percentage of daily hospital admissions has risen slightly to 24% since the middle of December.
If this is correct, the current admission rate of 4,066 new COVID patients per day points to up to 975 hospital deaths per day, to which must be added forecast COVID deaths in other settings such as care homes. Adding 30% for the latter suggests there could be 1,270 deaths per day in the second half of January.
Statistician Sir David Spiegelhalter of Cambridge University speaking separately on BBC TV said that, using his rule of thumb, hospital admissions were likely to be about 10% of reported new cases, one week after symptoms; and deaths were likely to be about 2% of new cases, 2 to 3 weeks after that - which points towards 1,200 hospital deaths per day by late January.
Forecast for the week ahead
The chart below shows how the number of COVID positive tests has been increasing since 1st December (in red) and forecast (in blue) following announcement of the lockdown. The forecast assumes a logistic curve with daily new cases peaking about 12th January.
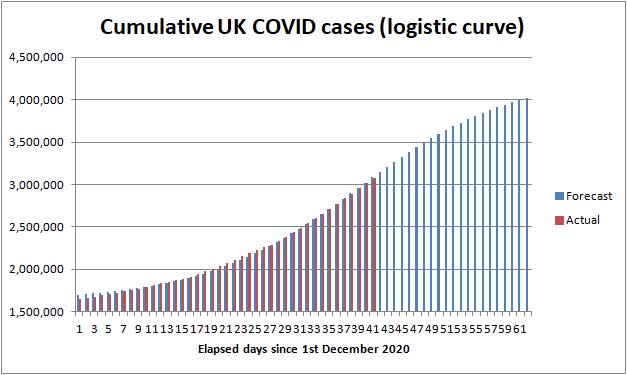
Illustration of possible rise in third wave cases to 31st January 2021
Trends suggest that during the next seven days (up to 17th January) the cumulative total of new UK COVID-19 cases reported by PHE on the Coronavirus Dashboard could increase by about 420,000 towards 3,493,000. If the lockdown is working, during next week the daily number of new cases should begin to level off and might even start falling.
In Worcestershire up to 3,750 new cases of COVID-19 can be expected, and possibly up to 300 cases in the Malvern Hills district.
We estimate the number of COVID (28) deaths could increase by about 7,000 nationally towards 89,000 during the 7 days ending 17th January 2021.
In the county of Worcestershire, assuming a 2% death rate, the 3,428 new cases this week could translate to about 70 Worcestershire deaths per week towards the end of January, but if cases are mostly confined to younger age groups it could be less.
Longer term forecast
The third wave of the COVID-19 epidemic in the UK
For the purpose of simple analysis, it has been assumed that a third wave of the COVID-19 epidemic began on or about 1st December, as the second lockdown drew to a close; see the new chart above where the logistic curve starts exponentially, reaches its half way point on the 8th January and then slows down to mimic the effect of the third lockdown.
Following the lockdown in England announced on 4th January, the daily rate of new cases of COVID should begin to fall after 11th so that by 18th January some downward movement should be detected in the 7 day rolling average of daily cases.
Those infected on the 4th January will fall sick about 11th January and the sickest of those will be admitted to hospital about 18th January. Of those admitted broadly 24% will die before the end of January. Consequently the lockdown will do very little to dampen demand for hospital beds until February; so in January hospitals are likely to be in the 'eye of the storm' treating COVID-19 patients and in our view the possibility of patient care suffering leading to an increase in mortality cannot be ruled out.
We anticipate the average COVID daily death rate could rise to between 900 and 1,200 deaths per day during January, possibly even higher if hospitals are briefly overwhelmed and doctors forced to choose who to save.
The death rate should then begin to fall in February as the effect of the lockdown and vaccinations begin to bear down on the virus.
Meanwhile the UK COVID death toll will continue to mount until the Vaccination Programme eventually draws the epidemic to a close. Currently we expect the UK COVID death toll could approach 120,000 by the end of March 2021; see commentary.
Exactly what happens will depend on the public's compliance with the lockdown, the effectiveness of test and trace, any change in the lethality of emerging strains of the virus, and most importantly the speed of the vaccine rollout.
Vaccines
The elderly are now being invited for vaccination in Malvern Town, so look out for a telephone call or text message from your surgery. We anticipate that the majority of 80+ year olds and key workers will get the vaccine in January, with a progressive rollout to younger Seniors in February, and March at the latest.
NHS England will be publishing a tally of the number of people vaccinated on an Excel spreadsheet, so you can monitor progress:-
Click for numbers of people vaccinated in England reported by NHS
A copy of TOTAL FIRST JABS also appears on the Coronavirus Dashboard which currently shows 1,296,432 but hasn't been updated for 4 days.
Advice for Seniors
 Coronavirus
is soaring throughout the country, and daily cases are rising in
Worcestershire, so the risk is approaching
VERY HIGH for Seniors living in the
Malvern Hills district; see our annex and riskometer opposite.
Coronavirus
is soaring throughout the country, and daily cases are rising in
Worcestershire, so the risk is approaching
VERY HIGH for Seniors living in the
Malvern Hills district; see our annex and riskometer opposite.
If you are unlucky and catch COVID there is a significant chance that you will either die or your long term health may be seriously damaged, so take care to protect yourself and those you love. 90% of COVID deaths are in those aged over 60 years according to NHS England statistics.
So if you are offered a jab grasp the opportunity with both hands.
The simple safeguards to remember are still to:
-
wash your HANDS thoroughly, using soap and hot water, for 20 seconds, including after handling deliveries to your home, to kill virus picked up from contaminated surfaces see note 1;
-
wear a FACE mask when unavoidably near other people for example when shopping, visiting hospital or the chemist;
-
SPACE at least 2 metres apart from others see note 2;
-
keep TIME near others as short as possible, see note 3;
-
self-isolate and book a test if you have COVID-19 symptoms (new continuous cough, fever or loss of, or change in, sense of smell or taste).
Hence the mantra:-
HANDS, FACE, SPACE, TIME - GET A TEST if you feel unwell.
Click for UK government Coronavirus guidance on what you can and cannot do
Remember, if you have symptoms of COVID-19 and can't count from one to ten out loud due to shortness of breath, you should immediately call your GP, 111 or 999 for advice.
Notes:
1) Wash your hands thoroughly before touching your face to avoid transferring virus from contaminated surfaces to your mouth, eyes and nose. If outdoors use hand gel.
2) Two metres is further than you think - roughly an arm and a walking stick away.
3) During the National Lockdown you should not mix with other households.
Minimise exposure time if you unavoidably find yourself mixing in a confined setting - an invisible mist of virus can build up in the air if the space is shared with an infectious person; imagine people exhaling cigarette smoke. Unless you wear a well fitting FFP3 hospital grade face mask you can breath this in; a face covering will offer little or no protection. The likelihood and extent you get sick will depend on the density of the airborne virus, which can be reduced by ventilation, and the duration of your exposure.
Annex to 10th January update
Commentary
Events have moved fast in the last week.
On the 4th January a COVID Lockdown and closure of schools was announced on the Scottish mainland during January.
The UK COVID Alert Level was raised from 3 to 5 meaning that 'there is a risk of health services being overwhelmed' and in the evening the PM announced on TV that due to rapidly rising COVID cases, and pressure on the NHS, England would enter a National Lockdown joining Scotland, Wales and Northern Ireland.
Click for Prime Minister's statement on coronavirus (COVID-19): 5 January 2021
Surprisingly the PM executed a very sharp U turn by saying schools in England would close except for the children of key workers, and vulnerable pupils; also that GCSE and A level exams would not take place in the summer. If all went well the restrictions could be eased after half term, on 22nd February, but legislation allows for the lockdown to be extended to 31st March 2021.
The PM held a later press conference on 7th January to explain the vaccination programme. The target is to vaccinate all those aged over 70 years by the middle of February and everyone aged over 18 years by the Autumn.
Click for Prime Minister's statement on coronavirus (COVID-19): 7 January 2021
On 8th January the BBC reported approval of the Moderna vaccine with 17 million doses expected in the Spring.
The Mayor of London, Sadiq Khan, declared a Major Incident in the capital due to the Ambulance Service and hospitals becoming overwhelmed by COVID patients. The infection in parts of London was now thought to be as high as 1 in 30.
The PM issued a STAY AT HOME message.
Chief Medical Officer Dr Chris Witty appeared on TV reminding people to take care and embrace the HANDS, FACE, SPACE message.
The over-zealous Derbyshire police dropped a clanger by fining two young women for visiting a local beauty spot; perhaps the officers imagined themselves to be auditioning for a sequel to Hot Fuzz. During the first wave Derbyshire police had berated a middle aged couple for walking their dog in the middle of nowhere. They had no legal basis for this and likely the fines will be rescinded.
Still no publicity about vaccinations in Malvern but at a Zoom meeting of Malvern Civic Society it emerged Seniors were being called for jabs in Malvern Town, and the process was said to be running like a well oiled machine!
Recent deaths in Worcestershire hospitals
The table below shows COVID deaths in Worcestershire Acute Hospitals Trust reported by NHS England in the 7 days to 9th January.
| Date | Number |
| 3rd January | 5 |
| 4th January | 3 |
| 5th January | 2 |
| 6th January | 8 |
| 7th January | 0 |
| 8th January | 0 |
| 9th January | 0 |
| Total | 18 |
Worcester Acute Trust hospitals COVID deaths in 7 days to 9th January 2020
In addition there were 2 deaths in care hospitals making 20 in all.
These figures are liable to update as gathering data can take several days. To date a cumulative total of 473 COVID deaths have been reported in Worcester Acute hospitals and 44 in 'Care' hospitals, which makes the actual increase in deaths since last week 29.
Present rate of new cases
This week, the average rate of infection per 100,000 population per week in England rose from 476 to 651. In comparison the figure for Worcestershire is 543 and that in the Malvern Hills 292.
As a guide one might expect the infection rate to be no more than 50 cases per 100,000 per week at this point of the epidemic; so it is hugely disappointing that, after 10 months of management by the government, the national infection rate is twelve times higher.
The epidemic is running out of control and Seniors need to be jolly careful.
The probability of catching Coronavirus in the Malvern Hills is close to HIGH, and combined with the significant risk of death makes us view the overall risk to Seniors, prior to inoculation, as approaching VERY HIGH.
The risk of death from Coronavirus for healthy teenagers is exceedingly small so for them the risk is LOW, whereas the middle aged can suffer from Long COVID so for them the risk might be assessed MODERATE.
Forecast of death rate during January and beyond
Deaths in the middle of January are 'baked in' - relating to people already infected. During this period the average daily death rate might be expected to creep up in proportion to the rise in daily new cases and hospital admissions; however it seems to us that in the last few days the death rate has been rising much faster for reasons we cannot explain. That makes predicting the death rate during the remainder of January very difficult.
Fitting an S shaped Logistic curve to third wave deaths suggest that the 7 day rolling average could peak at about 900 deaths per day in the second half of January and then gradually fall. However we would not be surprised if the death rate briefly approached 1,200 - 1,600 deaths per day, especially if hospitals were to be overwhelmed.
The lockdown and rollout of vaccines should begin to reduce the death rate from February onwards.
A projection of the future COVID-19 death toll and daily deaths can be found on The Institute for Health Metrics and Evaluation website.
Click for IHME projection of COVID-19 deaths
The IHME forecast suggests that the death toll in the UK from COVID in all settings could be heading towards 116,000 by the end of March 2021, when the epidemic might be tailing off, and the death rate falling below 100 deaths per day. We currently think that projection is 'not unreasonable'. Assuming the death rate averages 800 deaths per day during January and then falls linearly to 1st April, a back of the envelope calculation suggests about 48,000 more deaths can be expected which when added to the present cumulative total implies the UK death toll, on the basis recorded by PHE, could reach 120,000 by the end of March 2021; but the figure could be a little less if the vaccine is speedily rolled out.
At the start of the epidemic in March the Chief Scientific Adviser, Sir Patrick Valance, suggested a death toll of 20,000 would be a good outcome; on the other hand, Professor Neil Ferguson of Imperial College warned in some scenarios the death toll might be as high as 250,000; while we thought, in the very worst case assuming up to 1% of the UK population died the outcome might have been nearer 400,000 taking into account some build up of herd immunity.
So how well will the UK have done? When Sir Patrick Valance spoke off the top of his head there had been few deaths and he clearly did not want to 'scare the horses'. Professor Neil Ferguson was nearest the mark. A few might consider an outcome of the order of 120,000 deaths a fair result compared to a greater number of people dying in a very short space of time, more being permanently disabled by Long COVID, and temporary collapse of the NHS. Members of the Labour Party will no doubt say the UK has done poorly compared to the best performing countries such as Australia and Singapore where deaths have been much lower, not to mention the enormous expense of supporting those out of work and huge damage to the economy.
Ultimately there can be no winners or losers, but there must be a meaningful inquiry to learn lessons for the future.
Summary of Links
Symptoms
Article about the effects of Coronavirus on the human body
Reporting and how to obtain a test
How to get a test
https://www.nhs.uk/coronavirus
About joining the Zoe COVID Symptom Study:
Guidance
UK government Coronavirus guidance
Tiers
Guidance on tiers: what you need to know
Government postcode checker to find tier for other areas
Statistics
UK government Coronavirus Dashboard
Coronavirus Dashboard Interactive Map
ONS data on deaths in England and Wales (Excel spreadsheet)
NHS England COVID-19 Daily Deaths
NHS England COVID-19 Hospital Admissions
NHS England vaccination statistics
Reports
ONS Coronavirus (COVID-19) Roundup
The bigger picture
Worldometer summary of coronavirus cases worldwide
European Centre for Disease Prevention and Control info
https://www.ecdc.europa.eu/en/geographical-distribution-2019-ncov-cases
World Health Organisation info
Window on the USA
Centre for Disease Control (CDC)
American Association of Retired People (AARP)
Worcestershire
Help:
http://www.worcestershire.gov.uk/here2help
Worcestershire County Council COVID-19 information:
http://www.worcestershire.gov.uk/coronavirus
Here you will find a useful link,
'Website: Number of new cases by date in Worcestershire'
which displays interesting COVID charts and statistics for Worcestershire
Miscellaneous
Spanish Flu
Dr Jeff Kildea's commentary about the 1919 outbreak of Spanish Flu in Australia
Views of Martin McKee, Professor of European Public Health
Follow Martin McKee on Twitter
SAGE membership
Scientific Advisory Group for Emergencies (SAGE)
Scottish government:
Link to Scottish Government website
Link to Postcode checker for COVID restrictions by protection level in areas of Scotland
Welsh Government:
Guidance on COVID alert levels in Wales
![]()
The interpretations and opinions expressed are our own
Last updated 10th January 2021