Angus and Rosemary's Miscellany
of Malvern - Other Resources
|
Coronavirus (COVID-19) epidemic weekly update for Malvern SeniorsCOVID LOCKDOWN in ENGLAND Alert Level raised to 5 on January 4th INFECTION RATE HIGH PM says 'STAY AT HOME' Skip to menu of archived pages PreambleWe keep an eye on the published government figures to asses the level of risk in the Malvern Hills district, if there is an uptick in cases we will tell you. This page is updated every Sunday between 1800 and 2400 hours GMT. Information about Coronavirus can be found on the NHS website: https://www.nhs.uk/coronavirus
|
 How
to request a test
How
to request a test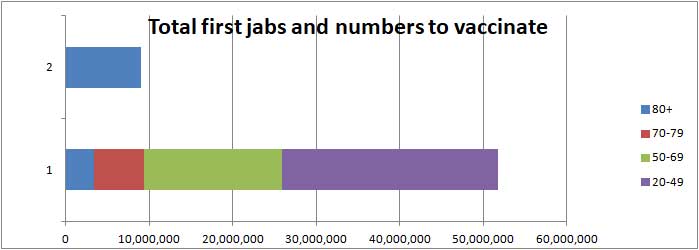
| Districts of Worcs | Cases | Weekly increase | Population |
| Bromsgrove | 5,485 | +250 | 98,529 |
| Malvern Hills | 2,242 | +138 | 77,545 |
| Redditch | 4,920 | +325 | 85,317 |
| Worcester | 5,127 | +323 | 103,542 |
| Wychavon | 5,313 | +449 | 126,240 |
| Wyre Forest | 4,547 | +276 | 100,957 |
| TOTAL | 27,634 | +1,761 | 592,130 |
| COMPARE WITH | |||
| County of Hereford | 5,956 | +279 | 195,000 |
| Leicester (city of) | 30,276 | +1,327 | 400,000 |
Cumulative cases reported by PHE in Worcestershire to 31st January 2021
Interactive map
At the bottom of the Coronavirus Dashboard (daily update) page there is an Interactive Map which is coloured to show the variation in infection rate across the country. The areas of highest infection coloured purple have mostly gone.
Click for Interactive Map of COVID cases
Note: the Interactive Map works on desktop PCs but it's possible you may encounter difficulties using a tablet or smartphone.
The number of cases fell slightly this week. Recent weekly cases to 26th January are: North Malvern 15; Malvern Link 18; Pickersleigh 15; Barnards Green 8; Malvern Wells and Priory 13; Callow End and Hanley 9; Upton and Welland 15. The picture changes daily.
Number of deaths
Statistics on COVID deaths are published by Public Health England, The Office of National Statistics, and NHS England.
PHE figures
Public Health England reports that the cumulative total of COVID (28) deaths in UK hospitals and care homes has risen by 8,219 in the last week to 106,158 while the daily average has fallen slightly from 1,242 to 1,174; see chart below which show the actual daily death rate in red, and our forecast to 14th February in blue.
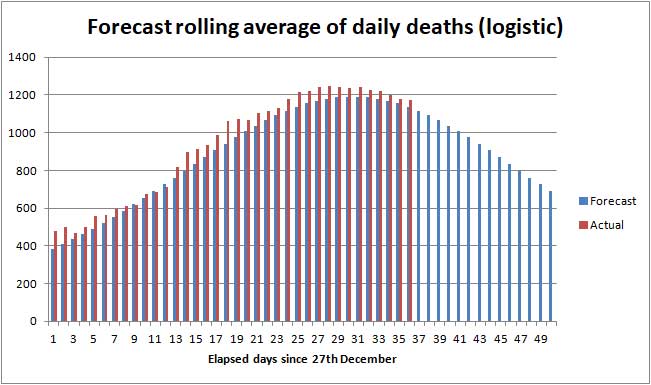
Actual daily UK death rate from 27th Dec to 31st Jan 2021 and forecast
It looks as though the death rate has peaked and should fall slightly next week.
Click to view the UK government Coronavirus Dashboard
In comparison averaged over recent years 1,700 people die daily from all causes.
In those districts where the COVID death rate is highest the storing of bodies in temporary mortuaries and delay to funeral services can be expected between now and the end of February.
ONS figures
The Office of National Statistics (ONS) separately reports registered deaths in England and Wales where COVID-19 is mentioned on the death certificate. The ONS figures lag the PHE figures by 10 - 14 days and do not include NI and Scotland, so are lower than the figures published by PHE.
The value of the ONS figures is that they are broken down by District so one can glimpse where deaths are occurring. The cumulative total of COVID related deaths in Worcestershire reported by the ONS up to 15th January 2021 (week 2 of 2021)) is shown below.
| Districts of Worcs | Deaths | Weekly increase | Population |
| Bromsgrove | 187 | +12 | 98,529 |
| Malvern Hills | 86 | +16 | 77,545 |
| Redditch | 121 | +5 | 85,317 |
| Worcester | 125 | +22 | 103,542 |
| Wychavon | 176 | +10 | 126,240 |
| Wyre Forest | 191 | +10 | 100,957 |
| TOTAL | 886 | +75 | 592,130 |
Cumulative COVID deaths registered by ONS to 15th January 2021
In the week ending 15th January, there were 75 COVID related deaths in Worcestershire, of which 14 were in care homes, 2 at home, and 59 in hospital.
In total in England and Wales 7,701 COVID related deaths were reported by the ONS in the week to 15th January, an increase of 1,196 (18%) on the week before.
The grim reaper in particular visited South Wales, Birmingham and South East England.
The highest number of hospital deaths (>29) by Lower Tier Local Authority were:
Kingston upon Hull 32, Leicester 33, Stoke on Trent 45, Southend on Sea 54, Thurrock 30, Medway (Kent) 68, Milton Keynes 32, County Durham 49, Cheshire East 34, Cheshire West 36, Bedford 40, Central Bedfordshire 34, Bournemouth Christchurch and Poole 42, Buckinghamshire 45, Basildon 35, Castle point 33, Epping Forest 33, Tendring 31, Liverpool 43, Sheffield 39, Swale 34, Birmingham 102, Walsall 30, Wolverhampton 39, Barking and Dagenham 37, Barnet 49, Bexley 35, Brent 30, Bromley 34, Croydon 51, Ealing 43, Enfield 57, Hackney 34, Havering 65, Hillingdon 41, Lambeth 32, Newham 52, Redbridge 54, Tower Hamlets 31, Waltham Forest 35, Carmarthenshire 31, Bridgend 49, Cardiff 35, Rhondda Cynon Taf 33, Betsi Cadwaladr University Health Board 57, Hywel Dda University Health Board 41, Aneurin Bevan University Health Board 61, Cardiff and Vale University Health Board 49, Cwm Taf Morgannwg University Health Board 88.
The cumulative total of COVID related deaths in England and Wales recorded by the ONS for all weeks of the epidemic rose to 99,892.
| Year | Cumulative COVID related deaths in England and Wales |
| 2020 | 85,686 |
| 2021 | 14,206 |
| TOTAL | 99,892 |
COVID death toll in England and Wales to 15th January 2021
Click for national ONS data on deaths (Excel spreadsheet)
NHS England figures
More recently in the seven days ending 30th January NHS England reported the cumulative total of deaths in Worcestershire hospitals rose by 50 to 705.
Click for NHS COVID-19 Daily Deaths
Healthcare numbers
The UK government Coronavirus Dashboard includes important information about healthcare statistics.
| Hospital cases (UK) | Number | Weekly change |
| Patients currently in hospital | 34,783 | -3,116 |
| Patients on ventilation | 3,832 | -244 |
| Patients admitted daily | 3,039 | -974 |
Headline summary of patients in hospital as reported 31st January 2021
These headline figures show the number of COVID patients in hospital has fallen slightly but we need to see the number falling further as hospitals are still under pressure.
Despite a fall, the number of patients on ventilators is 28% greater than in the first wave which is bad news as the outcome for patients on ventilators is poor.
Daily admissions have fallen by about 25% which is encouraging.
Figures for bed occupancy in Worcestershire hospitals can be found on the NHS England website:
Click for NHS England COVID-19 Hospital Activity
On 26th January there were 253 COVID patients occupying beds in Worcestershire Acute Hospitals at Worcester, Kidderminster and Redditch (an increase of 6% on last week), and a further 44 in 'care' hospitals. In England a total of 32,337 COVID beds were occupied a fall of 5% on last week.
Note: The Welsh First Minister said some time ago that very sick COVID patients arrive in hospital 7 to 10 days after first symptoms, and either die or are discharged 15 to 30 days after first symptoms in most cases. Hospital beds are occupied by suspected COVID patients, very sick COVID patients, and a few suffering from 'Long COVID' who may remain in hospital for much longer than 30 days.
Notes on projected figures
It appears hospitals are only admitting very sick COVID-19 patients, for example those with breathing difficulties, which is probably why Professor Peter Horby of Oxford University said on the Andrew Marr show that up to 20% of COVID patients in hospital could die.
The death rate compared to a percentage of daily hospital admissions, which has been higher than expected during the last 3 to 4 weeks, is reverting to the norm. The shape of the curve suggests the awful daily death rate has reached a peak so should begin to fall, slowly at first, within the next fortnight.
Statistician Sir David Spiegelhalter of Cambridge University speaking separately on BBC TV said that, using his rule of thumb, hospital admissions were likely to be about 10% of reported new cases, one week after symptoms; and deaths were likely to be about 2% of new cases, 2 to 3 weeks after that - which would point to about 480 hospital deaths per day in the second half of February.
Forecast for the week ahead
Trends suggest that during the next seven days (up to 7th February) the cumulative total of new UK COVID-19 cases reported by PHE on the Coronavirus Dashboard could increase by about 150,000 towards 3,970,000.
In Worcestershire up to 1,700 new cases of COVID-19 can be expected, and possibly up to 120 cases in the Malvern Hills district.
We estimate the number of COVID (28) deaths could increase by about 7,000 nationally towards 113,000 during the 7 days ending 7th February 2021.
In the county of Worcestershire, assuming a 2.4% death rate, the 1,761 new cases this week could translate to about 42 Worcestershire deaths per week by the middle of February, but if cases are mostly confined to younger age groups it could be less.
Longer term forecast
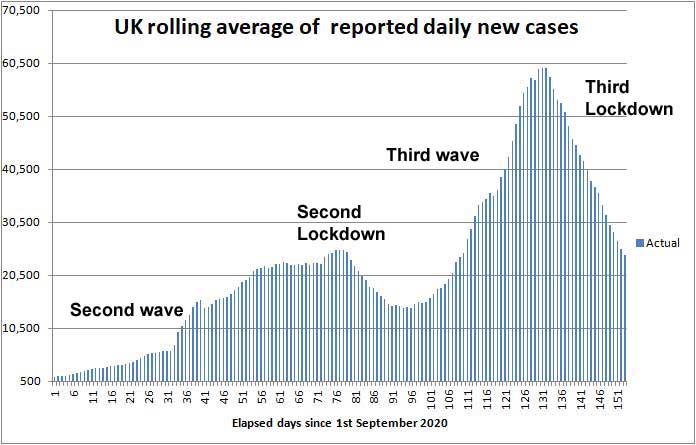
Ending of the third wave of the COVID-19 epidemic in the UK
Daily new cases of Coronavirus have been falling steadily since the introduction of the third lockdown due to physical distancing. Once all the population has been vaccinated (currently September) the restrictions can be relaxed. Relaxing the controls too early say in March, as the government probably intends, could lead to a wave of sickness, but vaccination of those aged 60+ should prevent an excessive death rate.
For the time being the death toll will continue to mount until the vaccination programme eventually draws this COVID-19 epidemic to a close. We expect the UK COVID death toll to reach 130,000 by the end of March 2021; see commentary.
Exactly what happens will depend on the public's compliance with the lockdown, the effectiveness of test and trace, any change in the lethality of emerging strains of the virus, future government policy, and most importantly the speed of the vaccine rollout.
Advice for Seniors
 The
daily number of new cases of Coronavirus is still unacceptable but we
judge the risk has reduced from 'Very High' to
HIGH for Seniors living in the
Malvern Hills district; see our annex and riskometer opposite.
The
daily number of new cases of Coronavirus is still unacceptable but we
judge the risk has reduced from 'Very High' to
HIGH for Seniors living in the
Malvern Hills district; see our annex and riskometer opposite.
If you are unlucky and catch COVID there is a significant chance that you will either die or your long term health may be seriously damaged, so take care to protect yourself and those you love. 90% of COVID deaths are in those aged over 60 years according to NHS England statistics.
So if you are offered a jab grasp the opportunity with both hands.
The simple safeguards to remember are still to:
-
wash your HANDS thoroughly, using soap and hot water, for 20 seconds, including after handling deliveries to your home, to kill virus picked up from contaminated surfaces see note 1;
-
wear a FACE mask when unavoidably near other people for example when shopping, visiting hospital or the chemist;
-
SPACE at least 2 metres apart from others see note 2;
-
keep TIME near others as short as possible, see note 3;
-
self-isolate and book a test if you have COVID-19 symptoms (new continuous cough, fever or loss of, or change in, sense of smell or taste).
Hence the mantra:-
HANDS, FACE, SPACE, TIME - GET A TEST if you feel unwell.
Pulse Oximeter
 A
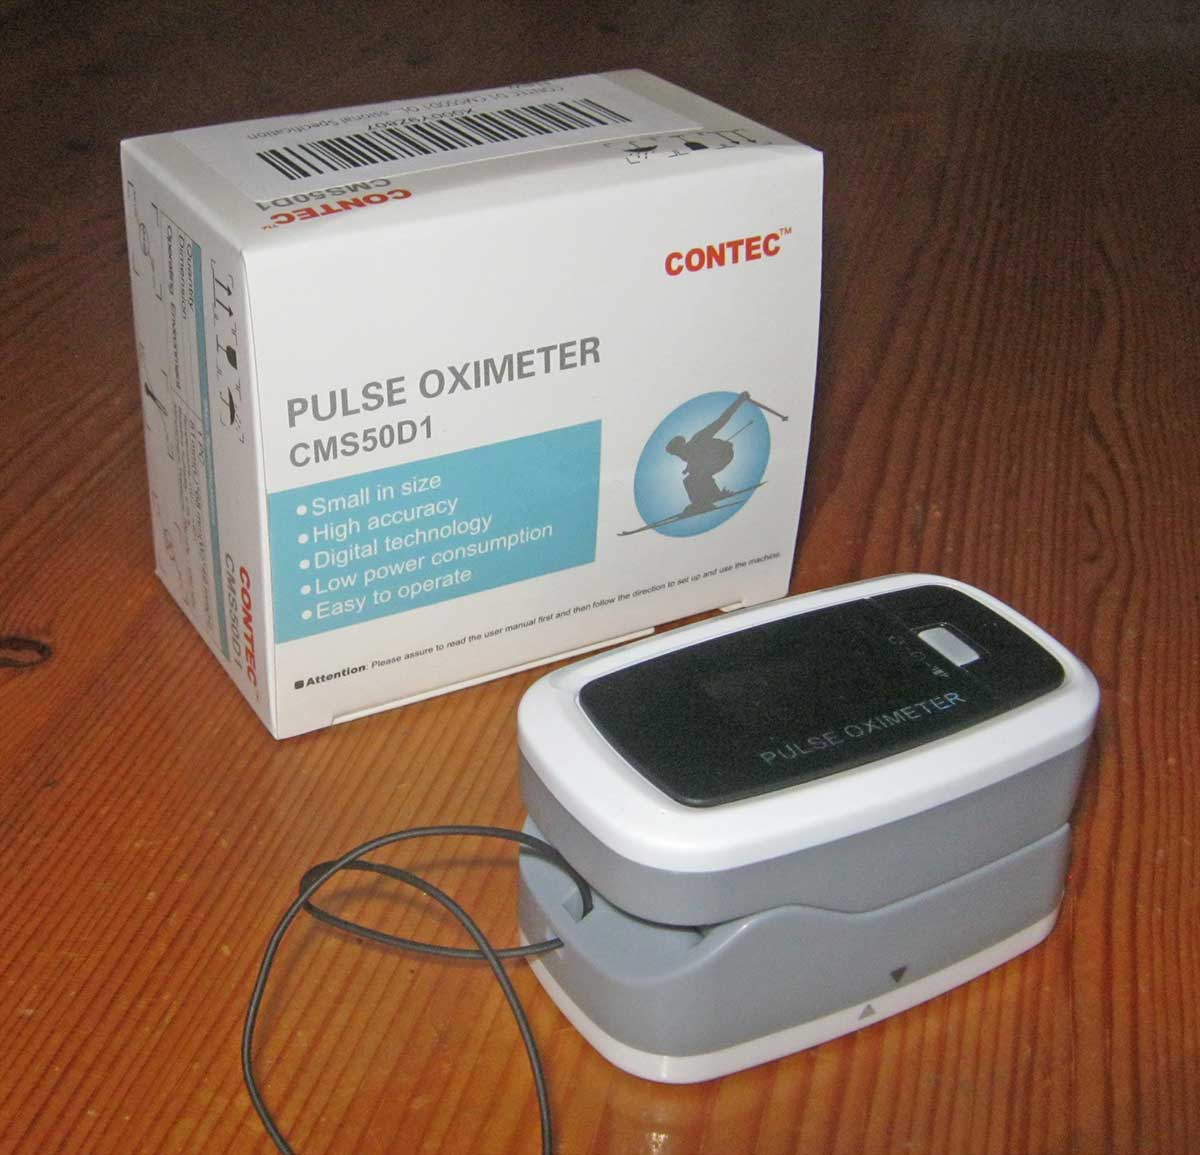
doctor in Bournemouth speaking on the evening news on Thursday suggested
that if you were sick with COVID at home it would be a good idea to have a
little device known as a Pulse Oximeter handy (see photo on right). This
measures the oxygen saturation in the blood and pulse rate by clipping the
device on a finger and pressing a button; the reading should normally be at
least 97%.
A
doctor in Bournemouth speaking on the evening news on Thursday suggested
that if you were sick with COVID at home it would be a good idea to have a
little device known as a Pulse Oximeter handy (see photo on right). This
measures the oxygen saturation in the blood and pulse rate by clipping the
device on a finger and pressing a button; the reading should normally be at
least 97%.
If the reading falls to about 93% you should call your doctor for advice, and if the reading drops below 92% you should consider calling an ambulance or visiting A&E.
Pulse Oximeters can be purchased from Amazon for £18 to £25; alternatively your doctor's surgery might loan you one if you are unwell and have tested COVID positive.
Remember, if you have symptoms of COVID-19 at home and can't count from one to ten out loud due to shortness of breath, you should immediately call your GP, 111 or 999 for advice.
Click for UK government Coronavirus guidance on what you can and cannot do
Notes:
1) Wash your hands thoroughly before touching your face to avoid transferring virus from contaminated surfaces to your mouth, eyes and nose. If outdoors use hand gel.
2) Two metres is further than you think - roughly an arm and a walking stick away.
3) During the National Lockdown you should not mix with other households.
Minimise exposure time if you unavoidably find yourself mixing in a confined setting - an invisible mist of virus can build up in the air if the space is shared with an infectious person; imagine people exhaling cigarette smoke. Unless you wear a well fitting FFP3 hospital grade face mask you can breath this in; a face covering will offer little or no protection. The likelihood and extent you get sick will depend on the density of the airborne virus, which can be reduced by ventilation, and the duration of your exposure.
Annex to 31st January update
Commentary
In the first half of the week the media went into hysterics about the COVID death toll reaching 100,000 and called for a road map out of lockdown, and for schools restarting; there was debate on the radio about vaccinating teachers. Statistician Sir David Spiegelhalter criticised the media for exaggerating headlines.
On Monday 25th January Matt Hancock gave a press briefing; he said ending of the lockdown would depend on hospital admissions and the daily death rate coming down, otherwise little new.
Click for 25th January statement
On Tuesday the PM gave a press briefing acknowledging the death toll reaching 100,000 and hinted at some form of national memorial.
Click for 26th January statement
Prof Calum Semple, a member of the Scientific Advisory Group for Emergencies, said on BBC2 Newsnight:
It would really not surprise me if we're looking at another 40-50,000 deaths before this burns out. The deaths on the way up are likely to be mirrored by the number of deaths on the way down in this wave. Each one again is a tragedy and each one represents probably four or five people who survive but are damaged by COVID.
On Wednesday the PM gave another press briefing announcing schools would restart no earlier than the 8th March; a road map would be presented when MPs returned after the half term holiday (22nd Feb). The route out of lockdown would depend on hospital admissions and the death rate falling, there being no interruptions to the vaccine rollout, and no increased threat from New Variant COVID.
Though not formally announced, we assume the third lockdown in England will now last to at least 8th March.
Click for 27th January statement
Sir Kier Starmer proposed that teachers should be vaccinated during half term, which seems a good idea to address the concerns of the Trade Unions, while Labour also wanted to see workers in critical professions such as police officers, firefighters and transport workers, vaccinated alongside those aged 50 - 69 years.
So far the PM has ignored this proposal. A problem is that the NHS computer which calls people for vaccination does not hold patients' professions in its database, so calling people by age is much easier.
However it should be easy to organise a scheme whereby teachers, for example those aged over 50 years, could attend special vaccination sessions at schools (subject perhaps to having a form signed by their head teacher and NHS number) - in a similar manner to vaccination of care home residents. Tony Blair speaking on Sky News on Sunday supported the idea of vaccinating teachers and suggested it might only delay the issue of vaccine to others by two days.
Towards the end of the week the BBC reported on a furious row brewing up between Astrazeneca and the EU concerning delay to the delivery of COVID vaccine caused by commissioning problems at new facilities. Bureaucrats in the EU hinted at vaccine being diverted from the British AstraZeneca factory, and threatened imposing measures on the export of eg Pfizer vaccine from the EU.
EU officials seemed to be attempting to blame others for their poor procurement decisions.
Click for BBC report on EU vaccine row
The PM said he was confident of UK supplies.
In Parliament, the Home Secretary, Pritti Patel, announced further travel restrictions:
Travellers returning to the UK from 'new variant COVID zones' would be sent to quarantine hotels for 10 days. The Commons were told that passengers would be met at the airport and transported directly into quarantine; countries include South America, South Africa and Portugal. There was also talk of travel from the UK being banned unless written good reason; which seems fair enough given people are supposed to be staying at home!
Recent deaths in Worcestershire hospitals
The table below shows COVID deaths in Worcester hospitals reported by NHS England in the 7 days to 30th January.
| Worcestershire | Cumulative deaths | Weekly increase | |
| Acute hospitals | 655 | +48 | |
| Care hospitals | 50 | +2 | |
| TOTAL | 705 | +50 |
Present rate of new cases
This week, the average rate of infection per 100,000 population per week in England fell slightly from 437 to 309. In comparison the figure for Worcestershire is 329 and that in the Malvern Hills 219.
As a guide we would expect the third lockdown to continue until the infection rate falls below 50 cases per 100,000 per week.
In the meantime seniors need to continue to be careful.
The probability of catching Coronavirus in the Malvern Hills is moderate to high, and combined with the significant risk of death makes us view the overall risk to Seniors, prior to inoculation, as HIGH.
The risk of death from Coronavirus for healthy teenagers is exceedingly small so for them the risk is LOW, whereas the middle aged can suffer from Long COVID so for them the risk might be assessed MODERATE.
Forecast of death rate during February and March
The average daily death rate appears to have peaked at 1,200 deaths per day and within the next week the lockdown and rollout of vaccines should begin to reduce the daily death rate, leading to a slow but steady fall during February, with deaths possibly tailing off to about 100 deaths per day during March. We predict the rolling 7 day average death rate could fall to about 900 deaths per day by 7th February and 650 by 14th.
Assuming the daily death rate is 1,200 at the beginning of February and falls to 200 by the end of February as a result of the vaccination of over 70 year olds, then the average will be 700 deaths per day leading to 19,600 additional deaths in February.
Then assuming the death rate falls further to 100 deaths per day by the end of March as a result of the vaccination of over 60 year olds, the average could be 150 deaths per day in March leading to 4,650 additional deaths.
Adding these 'back of the envelope' numbers suggests the UK COVID-19 death toll could reach 130,408 by the end of March.
| Date | Forecast UK COVID-19 death toll |
| January 31st | 106,158 |
| February 28th | +19,600 |
| March 31st | +4,650 |
| Total | 130,408 |
Forecast UK COVID-19 epidemic death toll
Another projection of the future COVID-19 death toll and daily deaths can be found on The Institute for Health Metrics and Evaluation website:
Click for IHME projection of COVID-19 deaths
Last month the UK projection was for 116,000 COVID deaths by the end of March, last week it was 123,000 and this week the projection has been increased to 162,000 which seems a little high to us.
At the start of the epidemic in March the Chief Scientific Adviser, Sir Patrick Valance, suggested a death toll of 20,000 would be a good outcome; on the other hand, Professor Neil Ferguson of Imperial College warned in some scenarios the death toll might be as high as 250,000; while we thought, in the very worst case assuming up to 1% of the UK population died the outcome might have been nearer 400,000 taking into account some build up of herd immunity.
So how well will the UK have done? When Sir Patrick Valance spoke off the top of his head there had been few deaths and he clearly did not want to 'scare the horses'. Professor Neil Ferguson was nearest the mark. A few might consider an outcome of 130,000 deaths a fair result compared to a greater number of people dying in a very short space of time, more being permanently disabled by Long COVID, and temporary collapse of the NHS. Members of the Labour Party and others will no doubt say the UK has done very poorly compared to the best performing countries such as Australia, New Zealand and Singapore where deaths have been much lower, not to mention the enormous expense of supporting those out of work and huge damage to the economy.
Ultimately there can be no winners or losers, but there must eventually be a thorough inquiry to learn lessons for the future.
Summary of Links
Symptoms
Article about the effects of Coronavirus on the human body
Reporting and how to obtain a test
How to get a test
https://www.nhs.uk/coronavirus
About joining the Zoe COVID Symptom Study:
Guidance
UK government Coronavirus guidance
Tiers
Guidance on tiers: what you need to know
Government postcode checker to find tier for other areas
Statistics
UK government Coronavirus Dashboard
Coronavirus Dashboard Interactive Map
ONS data on deaths in England and Wales (Excel spreadsheet)
NHS England COVID-19 Daily Deaths
NHS England COVID-19 Hospital Admissions
NHS England vaccination statistics
Reports
ONS Coronavirus (COVID-19) Roundup
The bigger picture
Worldometer summary of coronavirus cases worldwide
European Centre for Disease Prevention and Control info
https://www.ecdc.europa.eu/en/geographical-distribution-2019-ncov-cases
World Health Organisation info
Window on the USA
Centre for Disease Control (CDC)
American Association of Retired People (AARP)
Worcestershire
Help:
http://www.worcestershire.gov.uk/here2help
Worcestershire County Council COVID-19 information:
http://www.worcestershire.gov.uk/coronavirus
Here you will find a useful link,
'Website: Number of new cases by date in Worcestershire'
which displays interesting COVID charts and statistics for Worcestershire
Miscellaneous
Spanish Flu
Dr Jeff Kildea's commentary about the 1919 outbreak of Spanish Flu in Australia
Views of Martin McKee, Professor of European Public Health
Follow Martin McKee on Twitter
SAGE membership
Scientific Advisory Group for Emergencies (SAGE)
Scottish government:
Link to Scottish Government website
Link to Postcode checker for COVID restrictions by protection level in areas of Scotland
Welsh Government:
Guidance on COVID alert levels in Wales
![]()
The interpretations and opinions expressed are our own
Last updated 1st February 2021