Angus and Rosemary's Miscellany
of Malvern - Other Resources
|
Coronavirus (COVID-19) epidemic weekly update for Malvern SeniorsClick to read our observations on politics and world events 14th August 2022
PreambleFor more than two years we have been keeping an eye on the published government figures and monitoring the media to asses the likely level of risk for Seniors in the Malvern Hills district and providing links to where further information could be found. During the epidemic Public Health England was split into the UK Health Security Agency and Office for Health Improvements and Disparities. However for simplicity, in this blog, we have continued to refer to this as PHE data. Testing has been run down and the public can no longer record the result of Lateral Flow tests so the daily cases reported on the Coronavirus Dashboard greatly underestimate the actual situation, and so we have deleted our section on testing; this can however be found on archived pages. The only remaining sources of data indicating direction of travel are:
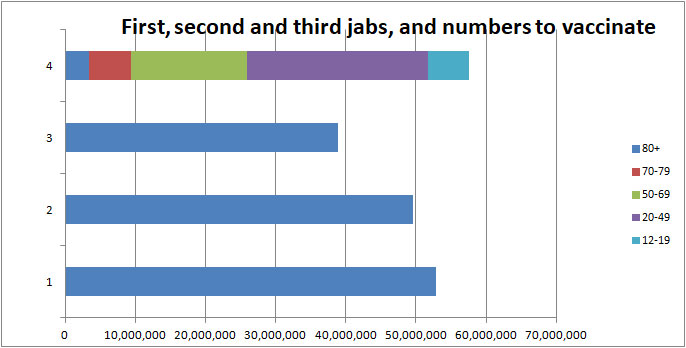
Now the epidemic is largely over the numbers are of less importance, but we'll carry on with our blog for a little while longer. This page will continue to be updated each weekend using Friday's data, nominally with Sunday's date. ContentsSummaryThere has been a steady downturn in COVID-19 infections as confirmed by a reduction in the number of patients admitted to hospital and a fall in COVID bed occupancy during the last three weeks. There are now signs the COVID death rate peaked at the end of July and is beginning to fall. However, because the Wuhan vaccines rarely stop us catching the latest variants and prevalence is still quite high, there is a fair chance some of us will catch COVID-19 in coming weeks despite being fully vaccinated. The lucky may either show few symptoms or have a mild fever, sore throat, general aches and pains, and quickly get over it; but others could feel quite poorly and spend a few days in bed, with it taking five to ten days or so to recover. Many of those who have caught COVID report either getting easily tired or suffering from shortness of breath for some weeks afterwards; if so patients are advised take it easy until fully recovered. Very few of those infected with Omicron are admitted to hospital. Any precautions to take are now a personal decision; see our advice. To reduce the likelyhood of hospitalisation amongst the most vulnerable, a second COVID-19 booster jab has been available to Seniors aged 75+ years known as the Spring Booster. UKHSA recommends everyone eligible should get it, but the Coronavirus Dashboard figures suggests about 20% of those aged 75+ in England have yet to step forward, if the vaccine hesitant are taken into account. Some surgeries are offering the Spring Booster, but if not you can still get it at the Three Counties Showground vaccination centre (use brown gate). Click for information about Walk-In Clinics Click for information about the Spring Booster Click for Worcestershire Dashboard and associated links The government says there will be an Autumn booster programme for those aged 50+ years; this will be a phased roll out of both COVID and Flu jabs; details to follow. Note: following Sajid Javid's resignation, Stephen Barclay is now Health Secretary. Monkeypox updateOutbreaks of Monkeypox have been detected in Europe and the UK. It's a serious and now a notifiable disease. Click below for European Centre for Disease Prevention and Control factsheet:- Factsheet for health professionals on Monkeypox AP News reports the WHO has declared this a global emergency. UN health agency chief declares monkeypox a global emergency As of 8 August 2022, there are 2,914 confirmed and 103 highly probable monkeypox cases in the UK: 3,017 in total. Of these, 2,883 are in England. A breakdown of cases by upper tier local authority has also been published today. This compares to 2,859 cases on 4th August, an increase of about 40 cases a day, as has roughly been the case for several weeks. Data will now be published once a week on Tuesdays. Click link: Monkeypox cases confirmed in England - latest UKHSA update The good news for Seniors is that vaccination for Smallpox, which we mostly had as children, should give protection from Monkeypox. How to get vaccinated for COVID-19Note: by now we expect most Seniors are fully vaccinated and if so you can skip this section. COVID has mutated so the original Wuhan vaccines do not stop the disease being passed on to someone else. The purpose of vaccination is now to minimise severe illness which results in hospitalisation, and possibly death. Children aged 5 - 11 years can be offered the vaccine, though only 10% or so have had a first dose in England. Prof Kit Yates of Independent SAGE thinks vaccination of children is a good thing but we suspect many parents are unsure. Those aged 16+ years can book a booster 3 months after their second dose. Click NHS link - Who can get a coronavirus (COVID-19) vaccine For information about walk-in centres in Worcestershire go to the website: and click the Vaccine Rollout tab at the top of the page. Click for information about vaccination at the Three Counties Showground Otherwise either see the NHS website for walk-in opening times and vaccine availability: Or click this link for more information and to book a vaccination on-line: Book a Coronavirus vaccination - NHS (www.nhs.uk) Or talk to your GP. More about vaccinationsVaccinometerOur bar chart below shows the total number of:
Vaccinometer as of 8th April 2022 People are still coming forward to be vaccinated, but the rate is so slow expect to see little change to this chart during 2022. Vaccination statistics are now of little relevance but can be found on the Vaccination tab of the Coronavirus Dashboard. What's more important is that those who have chosen to be vaccinated get their booster jabs. First booster jabsLast Christmas, all adults were offered a third jab (or booster) to reduce the likelyhood of hospitalisation after being infected by the Omicron variant of COVID-19. Spring booster jabs for SeniorsThose aged 75+ are eligible for a second (Spring) booster which ideally should be 6 months after the first booster. If you have COVID you must wait at least 28 days after infection before getting the jab. You should be contacted by the NHS and invited to book your spring booster when it's due - our invitation came by email followed a week later by a letter. Try to book an appointment around 6 months after your last dose to get the best protection from your Spring Booster (check the date on your vaccination card). New Court Surgery is currently not offering Spring Boosters so you may have to book your booster at a mass vaccination centre, such as the Three Counties Showground, either on-line or by phoning 119. There are also walk-in appointments at the Three Counties Showground (see links in 'how to get vaccinated section' for days and times). Clinics may be suspended during large events. Click to book a Coronavirus vaccination - NHS (www.nhs.uk) Click for NHS England COVID-19 Vaccination statistics Protection against hospitalisationThere is some uncertainty about how well the original Wuhan vaccines protect us from the latest variants of COVID-19. This is our judgement from reading the UKHSA reports:- After 3 months the Wuhan vaccines seem to give little protection from catching the Omicron variants of COVID-19 but importantly they are said to protect from going on to develop severe illness and admittance to hospital. The UKHSA COVID-19 vaccine surveillance reports indicate the effectiveness of the vaccines against earlier variants - four months or so after a third dose vaccine effectiveness against hospitalisation fell to about 80%, suggesting Seniors had been roughly 5 times less likely to go into hospital compared to an unvaccinated person. Note: there has been insufficient time to gather reliable data on the Spring Booster and the latest variants BA.4 and BA.5, so for example, the protection offered against hospitalisation by BA.5 after a Spring booster is largely unknown. Effectiveness against mortalityAfter a Booster the relative risk of death seems to be reduced by a factor of between 5 and 10 compared to the unvaccinated. Most people who die are aged 85+ years and most are fully vaccinated; this simply reflects that most of those who die are elderly, most of the elderly population is vaccinated, and the vaccines are not 100% effective. Here is a link to the latest report so you can make up your own mind about the effectiveness of the vaccines. Click for UKHSA COVID-19 vaccine surveillance report Week 31, 4th August 2022 Note: the next report will be in a month's time, on 1st September 2022. Vaccinations WorldwideA chart of the worldwide vaccination situation can be found on the Our World in Data website. Click for worldwide statistics Hint: click the country list on the left hand side of the screen to add or remove countries from the chart.
|
| Date published | Prevalence (England) | Ratio of people with COVID |
| 29th July 2022 | 2,632,200 | 1:20 |
| 5th August 2022 | 2,106,000 | 1:25 |
Prevalence of COVID-19 in England estimated by ONS
It's now two weeks since these statistics were gathered and cases will have dropped further.
Note: ONS said they are moving to an on-line data collection method and postal returns for swabs and blood samples and as a result of this change there will be likely be no weekly bulletin on Friday 12 August 2022. So expect the next weekly update on 19th August.
Zoe Health Study
The ZOE Health Study estimates are shown in the following table.
| Prevalence (UK) | Estimated new infections per day | |
| Last week | 2,977,309 | 151,569 |
| This week |
2,232,757 | 120,946 |
Prevalence of COVID-19 in UK estimated by the Zoe Health Study
According to the more up-to-date Zoe figures prevalence in the UK has fallen by 25% in the last week and daily cases fell by 20%.
Both the ONS and Zoe indicate the current wave of COVID is subsiding.
Numbers testing COVID positive in Worcestershire (PHE)
Note: this section has been deleted due to COVID testing being run down in the UK; figures can still be found on the Worcestershire Coronavirus dashboard, but these greatly underestimate the true number of infections. The direction of travel in Malvern is down.
Click for Worcestershire Coronavirus Dashboard
 Number
of deaths
Number
of deaths
Statistics on COVID deaths are published by Public Health England, The Office of National Statistics, and NHS England. These can't be directly compared as they cover different periods, but together the figures paint a picture of the direction of travel - which is that in real time COVID weekly deaths have peaked and are just beginning to fall.
PHE figures
The Dashboard chart of COVID (28) deaths, following a positive test, by date of death shows that the 7 day average peaked in England at 240 deaths per day about 10th April; and fell to a minimum of 40 about 10th June.
Deaths then rose once again peaking at 183 per day about 18th July, then falling to 128 by 1st August.
Note that some of the deaths reported by PHE will be people who die with COVID but not from it.
Click to view the UK government Coronavirus Dashboard
ONS figures
The Office of National Statistics (ONS) reports registered deaths in England and Wales where COVID-19 is mentioned somewhere on the death certificate. The ONS figures lag the PHE figures by 10 - 14 days and do not include Northern Ireland and Scotland.
Note: the figures include cases where COVID may have been a secondary cause of death.
Click for national ONS data on deaths (Excel spreadsheet)
The ONS figures are broken down by District providing a glimpse of where deaths are occurring. The provisional cumulative total of COVID related deaths in Worcestershire reported by the ONS up to 29th July (week 30 of 2022) is shown below.
Note: the numbers are from summation of rows 9 to 339 of the ONS Death Registrations-Pivot table, which gives the provisional total of deaths reported in any week, which can be distorted by delayed reporting over public holidays.
Deaths by 'date of death' is a more accurate metric but takes longer to be confirmed.
| Districts of Worcs |
Deaths 2020 |
Deaths 2021 |
Deaths 2022 |
Week 30 | Population |
| Bromsgrove | 164 | 142 | 45 | 1 | 98,529 |
| Malvern Hills | 61 | 98 | 51 | 1 | 77,545 |
| Redditch | 108 | 109 | 35 | 1 | 85,317 |
| Worcester | 87 | 134 | 38 | 2 | 103,542 |
| Wychavon | 157 | 154 | 61 | 1 | 126,240 |
| Wyre Forest | 171 | 132 | 48 | 2 | 100,957 |
| TOTAL | 748 | 769 | 278 | 8 | 592,130 |
Provisional cumulative COVID-19 deaths in Worcestershire registered by ONS to 29th July 2022.
There was 1 death in hospital in Bromsgrove; 1 death in hospital in the Malvern Hills; 1 death at home in Redditch; 1 death in a care home and 1 in hospital in the city of Worcester; 1 death in a care home in Wychavon; and 1 death in a care home and 1 in hospital in Wyre Forest.
In England and Wales 807 COVID-19 related deaths were reported in the week to 29th July, 64 more than the week before and a rise of 8%. Of these 100 were in a care home, 74 at home, 23 in a hospice, 604 in hospital and 6 elsewhere.
It looks like the ONS death rate levelled off around 1st August, and now 2 weeks later deaths should be falling.
So far this year in England and Wales 23,165 people have died with COVID mentioned on their death certificate.
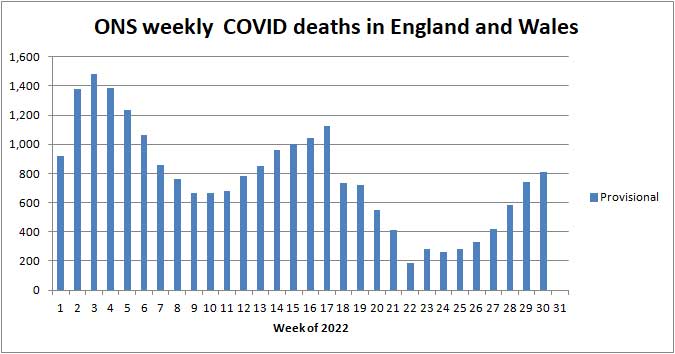
ONS provisional deaths 'by week reported' in England and Wales 2022
Note: the steps in the chart above in weeks 18 and 22 were probably due to delayed reporting over the Easter, Mayday and Jubilee holidays.
The figures on the Coronavirus Dashboard of ONS deaths by date on the death certificate show ONS England deaths peaked at 160 deaths per day on 8th April, dipped to 25 about 10th June, then increasing to 56 by 1st July (seven day average); then to 81 by 8th July; and to 97 by 15th July. A 20% increase on the previous week. But what you have to remember is these figures relate to what was happening almost a month ago - the more recent PHE figures suggest the death rate peaked towards the end of July and is now falling.
In comparison averaged over recent years 1,700 people die daily from all causes in the UK.
Click for ONS Coronavirus (COVID-19) latest insights: Deaths
NHS England figures for Worcestershire
The table below shows the latest COVID deaths in Worcestershire hospitals reported by NHS England on 11th August 2022.
| Worcestershire | Cumulative deaths | Past week |
| Acute hospitals | 1,144 | 4 |
| Care hospitals | 79 | 1 |
| TOTAL | 1,223 | 5 |
Excludes deaths in care homes, deaths at home and deaths in hospices.
Two fewer deaths than last week.
Click for NHS COVID-19 total announced deaths
Look for COVID Total announced deaths file, then select tab Deaths by Trust.
Note: NHS say all deaths are recorded against the date of death rather than the date the deaths were announced. As from 1st July 2022 reporting has moved to publication once per week on a Thursday, rather than every weekday.
Trend in Worcestershire COVID deaths this year
Since 1st January 2022 there has been a baseline level of up to 1 COVID death per day in NHS Worcester acute hospitals.
A peak of typically up to 3 deaths per day occurred either side of 1st April, with a more recent upturn of up to 2 deaths per day during July 2022. On some days no deaths were reported.
With a Worcestershire population of roughly 600,000 and assuming one COVID death per day that equates to 0.06% COVID deaths per year. Taking into account that most deaths are of the elderly the risk of Seniors dying of COVID this year will probably be less than 0.5%.
Worcestershire represents about 1% of the population of England, so all other factors being equal, one might expect the Worcestershire death rate to be one hundredth of the figure for England.
England peaked at about 800 (ONS) deaths per week at the end of July, so for Worcestershire assume a pro rata average of 8 deaths per week or 1 per day.
To get things in perspective, at the present time, Seniors are 20 times more likely to die of something else, for example cancer, heart attack, stroke, and old age.
For that reason most people now seem to be taking the view that COVID is no longer a critical threat to their health.
Risk of COVID-19 death by age band
NHS England provides an analysis of COVID-19 deaths in hospital in England and Wales by age band. Shown below is a snapshot of 2,898 recent deaths for the period 6th May 2022 to 6th July 2022 when most of these deaths will have been from the Omicron variants.
| Age band | Number of COVID deaths | % of deaths |
| 0 - 19 | 8 | 0.3 |
| 20 - 39 | 25 | 0.9 |
| 40 - 59 | 165 | 5.7 |
| 60 - 79 | 1,010 | 34.9 |
| 80+ | 1,692 | 58.4 |
Relative risk of COVID-19 death by age band May - July 2022
The main point to note is those aged 60+ still account for 93% of deaths despite young people being more likely to catch COVID-19.
The risk profile for Omicron appears to be the same as for Delta. Age is the greatest risk factor.
 Healthcare
numbers
Healthcare
numbers
The UK government Coronavirus Dashboard includes information about healthcare statistics and NHS bed occupancy.
| Hospital COVID cases (England) | Number | Change in last week |
| Patients currently in hospital | 8,487 | -1,330 |
| Patients on ventilation | 216 | -16 |
| Patients admitted daily | 956 | -168 |
Headline summary of patients in hospital reported on 10th August 2022
Note: 'Patients admitted daily' is the weekly total divided by 7. This number includes both patients admitted to hospital with COVID-19 from the community, and those diagnosed with COVID-19 in hospital.
The daily number of COVID patients admitted to hospital continues to fall.
It is said roughly half are being treated for COVID, and the remainder being treated for another condition with COVID.
Bed numbers by region in England
Tabulated figures for COVID bed occupancy in England can be found on the NHS England website and are another indicator of direction of travel:
Click for NHS England COVID-19 Hospital bed Activity statistics
Note: see the latest Daily Admissions and Beds spreadsheets, then look for all COVID beds.
| Region | 5th August 2022 | 11th August 2022 | 15th January 2021 |
| England | 9,152 | 8,327 | 33,362 |
| London | 1,756 | 1,601 | 7,811 |
| Midlands | 1,783 | 1,627 | 5,890 |
Comparison of All beds COVID data for England, London and Midlands
In the last week the number of COVID-19 General and Acute beds fell by about 9% in England, London and the Midlands.
For comparison, the number of beds occupied during the peak of the epidemic in January 2021 is shown in red in the right hand column of the table.
The chart below shows how COVID bed occupancy peaked in England about 18th July. Deaths can be expected to follow a similar shaped curve delayed by one week or so.
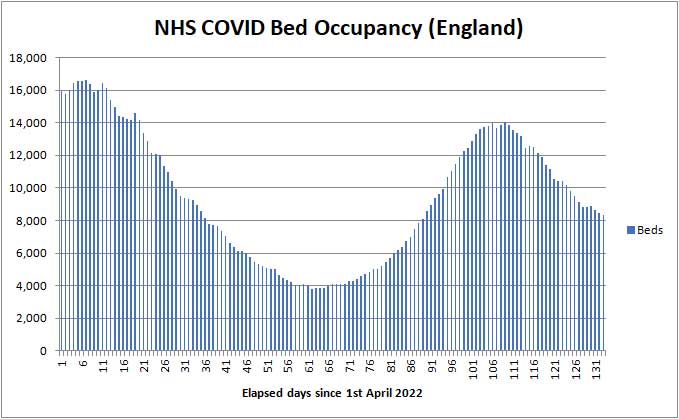
COVID bed occupancy in England from 1st April 2022 to 11th August
Worcestershire
hospital beds
Between 1 August 2022 and 7 August 2022, 78 patients went into hospital with coronavirus. This shows an increase of 4% compared to the previous 7 days. There were 102 patients in hospital with coronavirus on 9 August 2022 the same as the week before; the good news is there are no patients on a ventilator.
Click for Summary of Malvern numbers on the Coronavirus dashboard
This link also reports deaths.
Deaths in Malvern Hills
Between 30 July 2022 and 5 August 2022, there were no deaths within 28 days of a positive coronavirus test.
Forecast for the week ahead
We expect the number of COVID related weekly deaths in England and Wales (as registered by ONS) to be about 750 in Week 31 ending 7th August, to be reported on 16th August.
In the county of Worcestershire, based on 78 new hospital cases last week and assuming the ratio of all deaths (including those in care homes and at home) to be 1:11 of admissions, then there should be no more than 7 COVID deaths per week in the second half of August.
We expect NHS COVID bed occupancy to continue falling in England next week as the current wave of infection subsides.
Longer term outlook
Theoretically we were supposed to have entered the endemic stage of the disease with a high background level of infection, falling in the summer as more time is spent outdoors, and then rising in the winter. In the absence of safety measures, this model seems not to work for the latest variants of COVID-19.
Emerging factors are new variants against which the vaccines offer increasingly less protection; vaccinations waning in effectiveness; booster shots; overseas travel during school holidays; and super-spreader events such as summer music festivals; so it has become very difficult for computer models to predict what happens next.
It is already summer and instead of cases falling they had been rising; until two weeks ago. Hopefully cases will drop in August and September as the BA.5 wave subsides before possibly beginning to rise in October/November when more time is spent indoors with the windows shut.
The Omicron BA.1 variant became predominant in New Year 2022, followed by BA.2 and now BA.5 causing 3 waves of COVID so far, and there could be more ripples as new variants of concern emerge, but no sign of that at the moment.
About 4% of those infected could suffer from symptoms for up to 12 weeks; beyond that it is characterised as Long COVID. Long COVID caused by previous variants, such as Delta, could be extremely debilitating, but thankfully most cases attributable to Omicron are said to resolve in between 4 and 12 weeks. We assume Long COVID, referring to symptoms beyond 12 weeks, may be caused by pockets of lingering inflammation within the body - doctors don't seem to know the cause, but it's possible in a small number of cases there could be permanent tissue damage.
After dipping to about 200 deaths per week, ONS deaths have been rising tracking hospital admissions delayed by two weeks or so.
The England and Wales ONS death rate is likely to have peaked at about 750 COVID deaths per week in the last few days - which we should soon see reflected in the ONS numbers. Then the death rate should fall as infections and daily hospital admissions drop.
The recent rise in the death rate has been a temporary blip and nothing to worry about.
The recent fall in bed occupancy suggests the weekly death rate may drop from 750 to 425 in two weeks time.
UCL modelling is suggesting the COVID death rate may then fall to a minimum of 35 deaths per day, that is 245 certified deaths per week by the end of September, which is quite credible; then perhaps increasing to about 1,400 deaths per week during the winter months which would be concerning.
Click for UCL Long-term forecasting of the COVID-19 epidemic
The value of having future annual COVID vaccinations, as with Flu, is being questioned given the virus is so widespread and changing so fast. Unless there is a new vaccine capable of combatting different variants, it may be, as with the common cold, that next year we will have to soldier on with occasional repeat infections and no cure.
Most members of the British public appear reluctant to wear face masks, so there would be value in health professionals and engineers looking to improve ventilation in workplaces and public buildings in order to reduce the circulation of respiratory diseases. That would cost money so is unlikely to happen to any great extent; but perhaps improvements could be designed into new systems and buildings, and urgent consideration given to improving ventilation in schools where infections have always spread rapidly.
Cases of Influenza A are beginning to rise in Australia, which points to the possibility of a significant outbreak of Influenza in the UK in the winter. Because of lockdowns there hasn't been much Influenza for two years and the immunity of the population may have dipped. Catching Influenza and COVID at the same time could be bad news so don't forget your Flu jab in September/October.
It seems to us that while UK COVID deaths remain below 700 per week, it is unlikely the public and government will be concerned.
Advice for Seniors
The risk of exposure to COVID-19 has almost halved in the last month but remains MODERATE to HIGH in the UK and many European countries and this situation could continue for some months.
See our riskometer opposite.
Those at highest risk are said to include:
-
Seniors aged 75+ years who have not been fully vaccinated;
-
Seniors aged 75+ whose first booster is waning;
-
Pregnant women who have not been vaccinated.
Most people now seem to be taking the view that COVID is no longer a critical threat to their health.
For the more cautious the simple safeguards to remember are to:
-
make sure your COVID vaccinations are fully up to date - you must have a Booster to obtain significant protection from hospitalisation and death, and if that was more than 6 months ago, desirably a Spring Booster.
-
wash your HANDS thoroughly, using soap and hot water, for 20 seconds, including after handling deliveries to your home, to kill virus picked up from contaminated surfaces (see note 1);
-
when infection rates are high, ideally wear either a well fitting FACE covering, or better an FFP2 face mask when in crowded settings for example when in shops, theatres, health-care settings, and when using public transport;
-
SPACE at least 2 metres from people you don't feel safe with (see note 2);
-
preferably socialise with friends and other households outdoors in the FRESH AIR else, if you are indoors, either ventilate by keeping windows open as far as is practicable or consider putting a HEPA air purifier in the room, which could also help with hay fever;
-
avoid crowded indoor settings;
-
avoid friends and colleagues with cold and flu like symptoms;
-
ideally self-isolate for 5 to 10 days to protect others if you feel unwell with cold or flu like symptoms; according to the Zoe COVID Study the current top five COVID symptoms are sore throat, headache, cough, blocked nose, and runny nose, which may be difficult to distinguish from a common cold (see notes 3 and 4); other symptoms may include sneezing, tiredness and muscle aches and pains.
-
respect others and give them space;
-
looking further ahead, don't forget to get your annual Flu jab when it next becomes available; that is usually sometime in September/October.
Notes:
1) Wash your hands thoroughly before touching your face to avoid transferring virus from contaminated surfaces to your mouth, eyes and nose. If outdoors, wash hands with an alcohol based hand gel.
2) Two metres is further than you think - roughly an arm and a walking stick away.
3) The Zoe Health Study people suggest that if you have symptoms of a common cold there is a chance you might have COVID.
4) If you are 'clinically vulnerable' consult your GP or specialist; you may need to take a test and consider anti viral drugs if testing positive.
5) However careful you are, don't be too surprised if you catch COVID as the Omicron variants are highly infectious and the Wuhan vaccines give little protection against transmission and infection (although they do reduce the severity of symptoms).
Annex
Commentary
Nothing much to report this week. The prevalence of COVID-19 peaked about 3 weeks ago and is now steadily declining in all regions of the UK and all age groups.
Based on current rates of fall and Zoe's current estimate of 120,000 new infections per day, we hazard a guess, that barring new variants, new infections may halve to 60,000 per day by the end of August and halve again to 30,000 by the end of September, with the ONS COVID death rate falling proportionally towards 25 deaths per day in England.
More generally it sounds as though the NHS is fully stretched this summer and the situation can only get worse as winter approaches. Normally there is some spare capacity at this time of year.
BBC news reports the NHS plans 7,000 new beds this winter, but part of this will be 2,500 virtual beds with patients monitored at home - virtual beds smacks of Tory spin, but can it be real?
Click for Wikipedia article on Virtual Wards
Click for BBC report - Thousands more NHS beds to be created in England this winter
COVID video updates
Links to updates by Professor Tim Spector of the Zoe Health Study, Independent SAGE and pundit Dr John Campbell can be found here:-
Click to watch Zoe Health Study fortnightly update on 11th August 2022 presented by Tim Spector.
Tim's latest video, recorded while on holiday in France, briefly explores the latest news and rates on monkeypox, as well as plummeting daily COVID cases, the most recently recorded COVID symptoms, and some data on hypertension.
Click to watch Independent SAGE weekly update on 12th August 2022
Special public question and answer session. Topics risks, vaccines, Long Covid, masks, mitigation and more. Dr Deenan Pillay chairs and Dr Duncan Robertson does numbers.
Key points:
-
Delays at A and E up
-
Cancer waiting times up
-
Ambulance delays increasing
-
Vaccination of children 5 - 11 yrs advised but not happening
-
BA.5 dominant, no new variants of concern at present
-
Excess deaths 50 - 64 years up 10%
-
Excess deaths in Asian, Black and mixed race group up 30%
-
Most unlikely to catch COVID outdoors
-
Wear masks when COVID goes up eg in classroom
List of vaccines
Moderna is developing a new version of its vaccine designed to protect from both Wuhan and Omicron strains.
Here is the updated list of COVID-19 vaccines ordered by the UK. It looks as though the government has settled on the use of Pfizer and Moderna with Astrazeneca now held in reserve.
Moderna has been offered for Spring Boosters at the Three Counties Showground.
The order for Valneva has been cancelled, but nevertheless it has now been approved for use by MHRA.
Click for BBC report - Valneva Covid vaccine approved for use in UK
Nuvaxoid (Novavax) was approved in February.
The government has signed deals to buy 114 million additional doses of the Pfizer (54M) and Moderna (60M) vaccines to use in 2022 and 2023.
The press announcement goes on to say that 60M doses of Novavax vaccine are expected to be delivered in 2022 and 7.5M doses of GSK/Sanofi, so there seems no intention to cancel these late arrivals.
Click for Guardian report - Novavax expected to be become fourth Covid vaccine available in UK
| COVID-19 vaccine | Doses ordered (million) | Status |
| Pfizer BioNTech, two dose, -70 deg C | 40+60+35 | Approved, deliveries continuing, made in Belgium (EU). An additional 60M doses have been ordered for booster shots for the most vulnerable in the autumn. A further 35M doses were ordered in August 2021 for delivery in 2022. |
| Astrazeneca, two dose, fridge | 100 | Approved for those aged 30+ years; deliveries continuing. Batches made in UK, Belgium and India. |
| Moderna, two dose, -20 deg C | 7+10 | Approved. First deliveries to Wales and Scotland 7th April 2021 then England 13th April; mainly for those aged under 50 years awaiting vaccination. |
| Valneva, two dose | 60+40 order cancelled |
A jab from French company Valneva will be made in Livingston,
West Lothian, Scotland. Order cancelled September
2021. Delivery had been expected to start in second half of 2021. Approved by MHRA April 2022. |
| Janssen, single dose | 20 | Approved, a jab from Belgian firm Janssen, owned by Johnson and Johnson; UK approval 28th May. Order reduced from 30 to 20M. |
| Nuvaxovid | 60 | A jab manufactured by US firm Novavax being made in Stockton-on-Tees UK. Glaxo Smith Kline (GSK) contracted to fill and package vials. Approved by MHRA 3rd Feb 2022. JCVI to advise how vaccine will be used. |
| GSK Sanofi | 60 | Some delay due to adjusting the formula to give better protection to the elderly; expected approval and delivery of 7.5M doses in 2022. |
| Curevac | 50 ? | Contract placed with German company Feb 2021. Possible source of new variant vaccine; disappointing trial results have resulted in the company working on a second generation vaccine. Future uncertain. |
Table of vaccines ordered by the UK government
Summary of Links
Some of this information is now out of date but provides a historical context to the epidemic.
Information about Coronavirus can be found on the NHS website:
https://www.nhs.uk/coronavirus
Symptoms
Note: the list of symptoms was updated on 1st April 2022
Article about the effects of Wuhan Coronavirus on the human body
Reporting and how to obtain a test
How to get a test
https://www.nhs.uk/coronavirus
About joining the Zoe COVID Symptom Study:
Guidance
UK government Coronavirus guidance
See also - government sets out next steps for living with COVID
COVID-19 Response: Autumn and Winter Plan 2021 for England
UK Health and Security Agency (UKHSA) website
COVID Alert states
Guidance on UK COVID-19 alert level methodology: an overview
COVID-19 Alert Level lowered to 3 on 10th May 2021
Tiers
Guidance on tiers: what you need to know
Government postcode checker to find tier for other areas
Statistics
UK government COVID-19: Omicron daily overview
UK government Coronavirus Dashboard
Coronavirus Dashboard Interactive Map
ONS data on deaths in England and Wales (Excel spreadsheet)
NHS England COVID-19 Daily Deaths
NHS England COVID-19 Hospital Admissions
NHS England vaccination statistics
Worcestershire Coronavirus Dashboard
Worcestershire COVID-19 Vaccinations Dashboard
HSA COVID-19 vaccine weekly surveillance reports
Information about NHS hospital bed numbers: past, present, future
A glimpse of the worldwide vaccination situation can be found on the Our World in Data website.
Click for chart showing % vaccinated
Modelling
A forecast of the progression of the COVID-19 epidemic can be found on a University College London (UCL) website.
Click for UCL Long-term forecasting of the COVID-19 epidemic
A projection of the future COVID-19 death toll and daily deaths can be found on The Institute for Health Metrics and Evaluation website.
Click for IHME projection of COVID-19 deaths
Reports
Coronavirus (COVID-19) latest insights by ONS
A live roundup of the latest data and trends about the coronavirus (COVID-19) pandemic from the ONS and other sources.
MedRxiv is a US preprint server for Health Sciences. A depository for reports which have still to be peer reviewed.
COVID-19 rapid guideline: managing the long-term effects of COVID-19
NICE guidance on managing Long COVID
The bigger picture
Worldometer summary of coronavirus cases worldwide
European Centre for Disease Prevention and Control info
https://www.ecdc.europa.eu/en/geographical-distribution-2019-ncov-cases
World Health Organisation info
Window on the USA
Centre for Disease Control (CDC)
Find maps and charts tracking cases, deaths, and trends of COVID-19 in the United States.
American Association of Retired People (AARP)
Worcestershire
A local summary of COVID data can be found on the Worcestershire Coronavirus Dashboard.
Note 1: use the arrow <> buttons at the bottom of the Dashboard screen to move between pages.
Note 2: the figures for COVID cases are becoming meaningless as testing is run down.
Note 3: deaths are on page 7, and hospital beds on page 9.
Click for Worcestershire County Council COVID-19 news
There is a colourful webpage offering advice on learning to live with COVID for those aged under 30 years. 'Rona' is slang for Coronavirus.
Click for The Worcestershire 'Rona' Hub
Click for Simple Summary of Malvern numbers on the Coronavirus dashboard
Miscellaneous
Spanish Flu
Dr Jeff Kildea's commentary about the 1919 outbreak of Spanish Flu in Australia
Views of Martin McKee, Professor of European Public Health
Follow Martin McKee on Twitter
Views of Prof Christina Pagel, a member of Independent SAGE
Follow Christina Pagel on Twitter
SAGE membership
Scientific Advisory Group for Emergencies (SAGE)
Scottish government:
Link to Scottish Government website
Link to Postcode checker for COVID restrictions by protection level in areas of Scotland
Welsh Government:
Guidance on COVID alert levels in Wales
![]()
The interpretations and opinions expressed are our own
Last updated 14th August 2022