Angus and Rosemary's Miscellany
of Malvern - Other Resources
|
Coronavirus (COVID-19) epidemic weekly update for Malvern SeniorsClick to read our observations on politics and world events 4th September 2022
PreambleFor more than two years we have been keeping an eye on the published government figures and monitoring the media to asses the likely level of risk for Seniors in the Malvern Hills district and providing links to where further information could be found. During the epidemic Public Health England was split into the UK Health Security Agency and Office for Health Improvements and Disparities. However for simplicity, in this blog, we have continued to refer to this as PHE data. Testing has been run down and the public can no longer record the result of Lateral Flow tests so the daily cases reported on the Coronavirus Dashboard greatly underestimate the actual situation, and we have deleted our section on testing; this can however be found on archived pages. The only remaining sources of data indicating direction of travel are:
Now the epidemic seems largely over in the UK the numbers are of less importance, but we'll carry on with our blog for a little while longer. As sections become no longer relevant we are deleting them, but you can always refer back to archived pages. This page will continue to be updated each weekend using Friday's data, nominally with Sunday's date. ContentsSummaryFor most people COVID no longer represents a critical threat to health in Worcestershire - at present relatively few people are being admitted to hospital and only a handful a week are dying in a population of approximately 600,000. The COVID Omicron BA.5 death rate peaked at the end of July 2022 and has been gradually falling; there is however a little concern about excess deaths (10% or so above the five year average) which needs to be explained; it may perhaps be because patients could not see their doctor or treatment was delayed during the pandemic. While the prevalence of COVID has continued to fall, the Zoe Health Study reports a slight upturn in new infections in the last few days. There may be a further rise as children go back to school and winter sets in, but the effects of that may not be felt for several weeks. Any upturn could be either reduced or negated by the NHS Autumn booster campaign; this will depend on how many step forward to be jabbed (see next section). Because the Wuhan vaccines rarely stop people catching the Omicron variant and prevalence is still quite high, do not be surprised if you catch COVID despite being fully vaccinated. Some may either show no symptoms or have a mild fever, sore throat, general aches and pains, and quickly get over it; while others could feel quite poorly and spend between two and five days in bed, with it taking five to ten days or so to recover. Many of those who have caught COVID report either getting easily tired or suffering from shortness of breath for some weeks afterwards; if so patients are advised take it easy until fully recovered. Any precautions to take are now a personal decision. This bookmark will take you to the Worcestershire County Council webpage links at the end - there is little new to see. Click for Worcestershire Dashboard and associated links Booster shotsTo reduce the likelyhood of hospitalisation amongst the most vulnerable, a second COVID-19 booster jab has been available to Seniors aged 75+ years known as the Spring Booster. Click for information about the Spring Booster A further Autumn booster dose will now be offered to those aged 50+ starting with the oldest towards mid September. Millions of invitations will be landing on doormats from 7th September 2022 inviting people to book their appointment without delay as the NHS sets out to protect the nation from COVID-19 ahead of the winter. The NHS should contact you when it is your turn to book - you do not need to contact the NHS. For more information click this link:- NHS invites more than four million people for Autumn booster as care homes set to get first jabs The first of those eligible should be able to book a vaccine through the National Booking Service next week, with the first appointments available from the following week. Those with transport in Malvern and surrounds should be able to get a jab at the Three Counties Showground vaccination centre (use brown gate). Click for information about Walk-In Clinics You will be able to book if it is at least 3 months since your last jab, but we are wondering whether to wait 6 months which would suggest around November 2022 for us. Depending on availability you could be offered either of the original Pfizer and Moderna vaccines, or the new Pfizer and Moderna bivalent vaccines which protect against both the original Wuhan strain and Omicron BA.1. How to get vaccinated for COVID-19For older information about how to get vaccinated select an archived report eg Go to 'How to Get Vaccinated' section of the 7th August 2022 blog More about vaccinationsFor historic information about the vaccination programme select an archived report eg Go to 'Vaccination' section of the 7th August 2022 blog
|
| Date published | Prevalence (England) | Ratio of people with COVID |
| 5th August 2022 | 2,106,000 | 1:25 |
| 19th August 2022 | 1,432,900 | 1:40 |
| 26th August 2022 | 1,211,100 | 1:45 |
| 2nd September 2022 | 893,300 | 1:60 |
Prevalence of COVID-19 in England estimated by ONS
Zoe Health Study
The ZOE Health Study estimates are shown in the following table.
| Prevalence (UK) | Estimated new infections per day | |
| 26th August 2022 | 1,584,981 | 102,457 |
| 3rd September 2022 |
1,488,559 | 106,548 |
Prevalence of COVID-19 in UK estimated by the Zoe Health Study
According to the more up-to-date Zoe figures prevalence in the UK has fallen by only 6% in the last week, while daily cases have risen by 4%.
The Zoe figures suggest the current wave of COVID may be reaching a plateau.
Numbers testing COVID positive in Worcestershire (PHE)
Note: this section has been deleted due to COVID testing being run down in the UK; figures can still be found on the Worcestershire Coronavirus dashboard, but these greatly underestimate the true number of infections. The direction of travel in Malvern is down.
Click for Worcestershire Coronavirus Dashboard
 Number
of deaths
Number
of deaths
Statistics on COVID deaths are published by Public Health England, The Office of National Statistics, and NHS England. These can't be directly compared as they cover different periods, but together the figures paint a picture of the direction of travel - which is that COVID weekly deaths have been falling.
PHE figures
The Dashboard chart of COVID (28) deaths, following a positive test, by date of death shows that the 7 day average peaked in England at 183 per day about 18th July, then steadily falling to 66 by 22nd August.
Note that some of the deaths reported by PHE will be people who die with COVID but not from it.
Click to view the UK government Coronavirus Dashboard
ONS figures
The Office of National Statistics (ONS) reports registered deaths in England and Wales where COVID-19 is mentioned somewhere on the death certificate. The ONS figures lag the PHE figures by 10 - 14 days and do not include Northern Ireland and Scotland.
Note: the figures include cases where COVID may have been a secondary cause of death.
Click for national ONS data on deaths (Excel spreadsheet)
The ONS figures are broken down by District providing a glimpse of where deaths are occurring. The provisional cumulative total of COVID related deaths in Worcestershire reported by the ONS up to 19th August (week 33 of 2022) is shown below.
Note: the numbers are from summation of rows 9 to 339 of the ONS Death Registrations-Pivot table, which gives the provisional total of deaths reported in any week, which can be distorted by delayed reporting over public holidays.
Deaths by 'date of death' is a more accurate metric but takes longer to be confirmed.
| Districts of Worcs |
Deaths 2020 |
Deaths 2021 |
Deaths 2022 |
Week 33 | Population |
| Bromsgrove | 164 | 142 | 45 | 0 | 98,529 |
| Malvern Hills | 61 | 98 | 55 | 3 | 77,545 |
| Redditch | 108 | 109 | 38 | 2 | 85,317 |
| Worcester | 87 | 134 | 41 | 1 | 103,542 |
| Wychavon | 157 | 154 | 69 | 3 | 126,240 |
| Wyre Forest | 171 | 132 | 51 | 0 | 100,957 |
| TOTAL | 748 | 769 | 299 | 9 | 592,130 |
Provisional cumulative COVID-19 deaths in Worcestershire registered by ONS to 19th August 2022.
There were 2 deaths in hospital and 1 elsewhere in the Malvern Hills; 2 deaths in hospital in Redditch; 1 death at home in the city of Worcester; and 2 deaths in care homes and 1 at home in Wychavon.
Two weeks ago 721 deaths were reported in England and Wales in the week to 5th August. Then 591 deaths were reported of which 7 were in Worcestershire in week ending 12th August.
In England and Wales 549 COVID-19 related deaths were reported in the latest week to 19th August, 42 less than the week before and a fall of just 7%. Of these 87 were in a care home, 50 at home, 7 in a hospice, 403 in hospital and 2 elsewhere.
Deaths in Wales represent about 5% of the total.
So far this year in England and Wales 25,026 people have died with COVID mentioned on their death certificate.
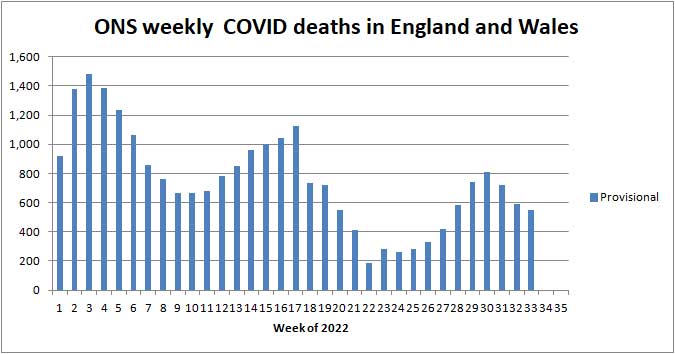
ONS provisional deaths 'by week reported' in England and Wales 2022
Note: the steps in the chart above in weeks 18 and 22 were probably due to delayed reporting over the Easter, Mayday and Jubilee holidays.
The figures on the Coronavirus Dashboard of ONS deaths by date on the death certificate show ONS England deaths peaked at 120 deaths per day on 18th July; since gradually falling to 71 deaths per day by 5th August.
Note: reference to June in the last blog should have read July.
In comparison averaged over recent years 1,700 people die daily from all causes in the UK.
Click for ONS Coronavirus (COVID-19) latest insights: Deaths
NHS England figures for Worcestershire
The table below shows the latest COVID deaths in Worcestershire hospitals reported by NHS England on 31st August 2022.
| Worcestershire | Cumulative deaths | Past 2 weeks |
| Acute hospitals | 1,154 | 4 |
| Care hospitals | 81 | 1 |
| TOTAL | 1,235 | 5 |
Excludes deaths in care homes, deaths at home and deaths in hospices.
In fact no deaths were reported last week and 5 this week; too small a number to establish a trend.
Click for NHS COVID-19 total announced deaths
Look for COVID Total announced deaths file, then select tab Deaths by Trust.
Note: NHS say all deaths are recorded against the date of death rather than the date the deaths were announced. As from 1st July 2022 reporting has moved to publication once per week on a Thursday, rather than every weekday.
Trend in Worcestershire COVID deaths this year
Since 1st January 2022 there has been a baseline level of up to 1 COVID death per day in NHS Worcester acute hospitals.
A peak of typically up to 3 deaths per day occurred either side of 1st April, with a more recent upturn of up to 2 deaths per day during July 2022. On some days no deaths were reported.
With a Worcestershire population of roughly 600,000 and assuming one COVID death per day that equates to 0.06% COVID deaths per year. Taking into account that most deaths are of the elderly the risk of Seniors dying of COVID this year will probably be less than 0.5%.
Worcestershire represents about 1% of the population of England, so all other factors being equal, one might expect the Worcestershire death rate to be one hundredth of the figure for England.
England peaked at about 800 (ONS) deaths per week at the end of July, so for Worcestershire assume a pro rata average of 8 deaths per week or 1 per day.
To get things in perspective, at the present time, Seniors are 20 times more likely to die of something else, for example cancer, heart attack, stroke, and old age.
For that reason most people now seem to be taking the view that COVID is no longer a critical threat to their health.
Risk of COVID-19 death by age band
NHS England provides an analysis of COVID-19 deaths in hospital in England and Wales by age band. Shown below is a snapshot of 2,898 recent deaths for the period 6th May 2022 to 6th July 2022 when most of these deaths will have been from the Omicron variants.
| Age band | Number of COVID deaths | % of deaths |
| 0 - 19 | 8 | 0.3 |
| 20 - 39 | 25 | 0.9 |
| 40 - 59 | 165 | 5.7 |
| 60 - 79 | 1,010 | 34.9 |
| 80+ | 1,692 | 58.4 |
Relative risk of COVID-19 death by age band May - July 2022
The main point to note is those aged 60+ still account for 93% of deaths despite young people being more likely to catch COVID-19.
The risk profile for Omicron appears to be the same as for Delta. Age is the greatest risk factor; perhaps reflecting that older people have more health problems.
Healthcare
numbers
The UK government Coronavirus Dashboard includes information about healthcare statistics and NHS bed occupancy.
| Hospital COVID cases (England) | Number | Change in last week |
| Patients currently in hospital | 5,658 | -644 |
| Patients on ventilation | 144 | -6 |
| Patients admitted daily | 589 | -97 |
Headline summary of patients in hospital reported on 31st August 2022
Note: 'Patients admitted daily' is the weekly total divided by 7. This number includes both patients admitted to hospital with COVID-19 from the community, and those diagnosed with COVID-19 in hospital.
The daily number of COVID patients admitted to hospital continues to fall. See charts on the Coronavirus Dashboard and below.
COVID daily NHS hospital admissions in England
The next chart shows how COVID daily hospital admissions have varied since 1st April 2022.
Note: shows the number of patients admitted in previous 24 hours where patient known to have COVID-19 plus patients diagnosed in hospital with COVID-19 in previous 24 hours.
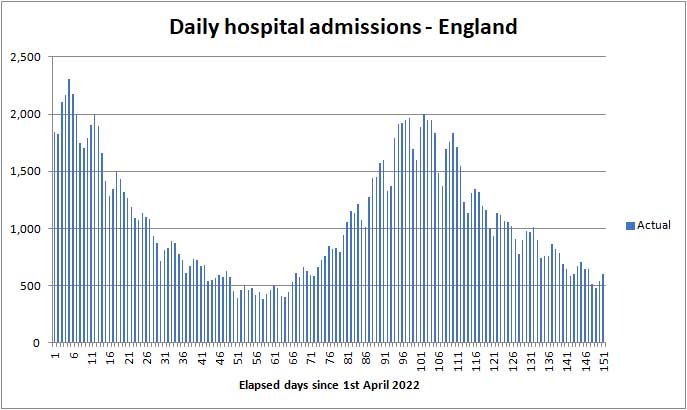
NHS England - COVID daily admissions to 29th August
Due to scatter on the chart it's not clear what direction hospital admissions will take next week.
Bed numbers by region in England
Tabulated figures for COVID bed occupancy in England can be found on the NHS England website and are another indicator of the prevalence of COVID.
Click for NHS England COVID-19 Hospital bed Activity statistics
Note: see the latest Daily Admissions and Beds spreadsheets, then look for all COVID beds.
| Region | 24th August 2022 | 31st August 2022 | 15th January 2021 |
| England | 6,302 | 5,658 | 33,362 |
| London | 1,243 | 1,073 | 7,811 |
| Midlands | 1,206 | 1,005 | 5,890 |
Comparison of All beds COVID data for England, London and Midlands
In the last week the number of COVID-19 General and Acute beds fell by between 10 and 15% in England, London and the Midlands.
For comparison, the number of beds occupied during the peak of the epidemic in January 2021 is shown in red in the right hand column of the table.
The chart below shows how COVID bed occupancy peaked in England about 18th July. The peak in beds is about one week delayed on the peak in daily admissions.
In the last few days there have been signs COVID bed occupancy may be reaching a plateau of about 5,500 beds in England. We'll have to wait a week or two to see if this is real or a statistical blip.
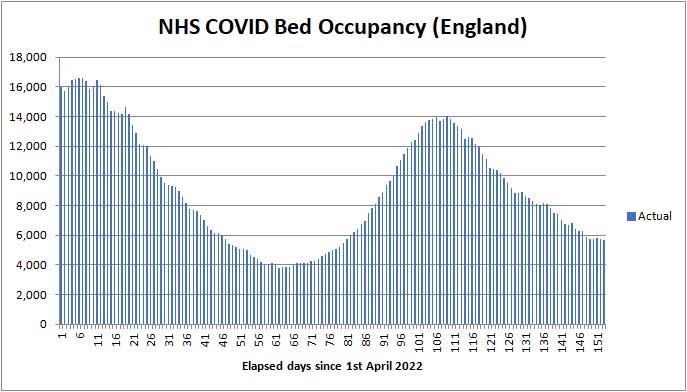
COVID bed occupancy in England from 1st April to 31st August 2022
Deaths can be expected to follow a similar shaped curve to bed occupancy delayed by one week or so.
Worcestershire
hospital beds
Between 22 August 2022 and 28 August 2022, 30 patients went into hospital with coronavirus. This shows a decrease of 34% compared to the previous 7 days. There were 53 patients in hospital with coronavirus on 30 August 2022; one on a ventilator.
Click for Summary of Malvern numbers on the Coronavirus dashboard
This link also reports deaths.
Deaths in Malvern Hills
Between 20 August 2022 and 26 August 2022, there were no deaths within 28 days of a positive coronavirus test.
Forecast for the week ahead
We expect about 500 COVID related weekly deaths in England and Wales (as registered by ONS) in week 34 ending 26th August, to be reported on 6th September.
In the county of Worcestershire, based on 30 new hospital cases last week and assuming the ratio of all deaths (including those in care homes and at home) to be 1:11 of admissions, then there should be no more than 3 COVID deaths per week in the second half of September.
NHS COVID bed occupancy could continue to fall but might flat-line in England next week.
Longer term outlook
Theoretically we were supposed to have entered the endemic stage of the disease with a high background level of infection, falling in the summer as more time is spent outdoors, and then rising in the winter, but that is not what happened.
Factors have been the new Omicron variants against which the vaccines offered little protection from infection; vaccinations waning in effectiveness; booster shots; overseas travel during school holidays; and super-spreader events such as summer music festivals and sports events
Consequently it has become difficult for computer models to predict what happens next.
Currently there are no signs of a new variant of concern so infections could fall during September, except for the fact children go back to school and students to university, which could increase infections; including amongst their parents.
Based on current rates of fall in COVID beds we hazard a guess the ONS death rate could fall to between 360 and 400 deaths per week or about 54 deaths per day in England and Wales by the end of September.
New infections may then rise in October/November due to educational mixing and more time being spent indoors with the windows shut.
To counter this the NHS is offering Autumn booster shots to those aged 50+ years to protect the most vulnerable from serious illness; however we wonder to what extent there will be vaccine fatigue - that is people who for one reason or another do not get their booster shot.
A new factor is the dramatic surge in inflation and the cost of energy. The Clear and Present Danger is - if the poor cannot afford adequately to eat and heat their homes those that fall sick with COVID will more likely be hospitalised putting a greater strain on the NHS.
UCL modelling charts suggesting the COVID death rate may fall to a minimum of 35 deaths per day, that is 245 certified deaths per week by the end of September, which is credible; but concerningly the charts hint at a possible rise towards 1,400 deaths per week during the winter months.
Click for UCL Long-term forecasting of the COVID-19 epidemic
What happens will greatly depend on the uptake and effectiveness of the Autumn booster shots, human behaviour, such as mask wearing, and the effect of inflation and energy pricing on the public's health.
We can be fairly sure that the COVID death rate will rise in the winter; but we'll have to wait and see by how much.
In our opinion, providing the death rate remains below 700 deaths per week it is unlikely either the public or the government will be concerned.
Advice for Seniors
We currently judge the risk of exposure to COVID-19 as MODERATE in the UK.
See our riskometer opposite.
Many people are taking the view that COVID is no longer a critical threat to their health.
For the more cautious the simple safeguards to remember are to:
-
make sure your COVID vaccinations are fully up to date
-
wash your HANDS thoroughly, using soap and hot water, for 20 seconds, including after handling deliveries to your home, to kill virus picked up from contaminated surfaces (see note 1);
-
if infection rates become high, ideally wear either a well fitting FACE covering, or better an FFP2 face mask when in crowded settings for example when in shops, theatres, health-care settings, and when using public transport;
-
SPACE at least 2 metres from people you don't feel safe with (see note 2);
-
preferably socialise with friends and other households outdoors in the FRESH AIR else, if you are indoors, either ventilate by keeping windows open as far as is practicable or consider putting a HEPA air purifier in the room;
-
avoid crowded indoor settings;
-
avoid friends and colleagues with cold and flu like symptoms;
-
ideally self-isolate for 5 to 10 days to protect others if you feel unwell with cold or flu like symptoms; according to the Zoe COVID Study the current top five COVID symptoms are sore throat, headache, cough, blocked nose, and runny nose, which may be difficult to distinguish from a common cold; other symptoms may include sneezing, tiredness and muscle aches and pains.
-
respect others and give them space;
-
looking further ahead, don't forget to get your annual Flu jab when it next becomes available; that is usually sometime in September/October.
Notes:
1) Wash your hands thoroughly before touching your face to avoid transferring virus from contaminated surfaces to your mouth, eyes and nose. If outdoors, wash hands with an alcohol based hand gel.
2) Two metres is further than you think - roughly an arm and a walking stick away.
3) If you are 'clinically vulnerable' consult your GP or specialist; you may need to take a test and consider anti viral drugs if testing positive.
4) However careful you are, don't be too surprised if you catch COVID as the Omicron variants are highly infectious and the Wuhan vaccines give little protection against transmission and infection (although they do reduce the severity of symptoms).
5) You may still have to take a test and wear a facemask when travelling to some overseas countries.
Annex
Commentary
This week
It seems like COVID has gone away, but most of a family group gathered at a seaside resort in Malaysia caught it. All were vaccinated and not severely affected.
Mask wearing in Singapore has been relaxed and is now only necessary on public transport and in healthcare settings.
There are signs the fall in the prevalence of COVID in the UK is slowing so infections may possibly go up as children return to school
Testing by hospitals of patients and staff showing no symptoms of COVID-19 has been discontinued.
JCVI has published new advice for pregnant women and those breast feeding but Dr John Campbell in one of his Youtube videos highlights the government is sending mixed messages (see link below).
Autumn booster jabs should start to be rolled out in a week or two:-
The MHRA has approved the new Pfizer bivalent vaccine for Autumn Boosters:-
JCVI approval has yet to be obtained; no statement yet on number of doses and delivery schedule.
COVID video updates
Links to updates by Professor Tim Spector of the Zoe Health Study, Independent SAGE and pundit Dr John Campbell can be found here:-
Click to watch Zoe Health Study fortnightly update on 25th August 2022 presented by Tim Spector.
Tim discusses the polio detection in London sewers; the ZOE Blood Pressure Study and initial results; the latest COVID data on rates which have levelled off, as well as which symptoms have reduced the most over the last month now that the Omicron BA.5 variant is dominant.
Tim also discusses the Astrazeneca COVID drug Evusheld and the UK government's decision to retract its use - an issue of interest to the immuno compromised.
The last Independent SAGE briefing was on 12th August.
Click to watch Independent SAGE weekly update on 12th August 2022
Dr John Campbell talks about vaccine guidelines in his 2nd September video:
Click for Dr John Campbell's talk on vaccine guidelines for pregnant women
Dr Campbell talks in another video about the probability of natural immunity from a previous infection protecting from from catching the BA.5 variant.
Dr John Campbell talks about natural immunity in Portugal
This seems to range from 50% to 75%.
List of vaccines
Autumn bivalent boosters
A second bivalent vaccine has been approved 3rd September 2022 as a booster by the Medicines and Healthcare products Regulatory Agency (MHRA) after it was found to meet the UK regulator’s standards of safety, quality and effectiveness. The updated booster vaccine made by Pfizer/BioNTech, targeting two coronavirus variants, has been approved for use in individuals aged 12 years and above.
An updated version of the COVID-19 vaccine made by Moderna that targets two coronavirus variants (known as a bivalent vaccine) has been approved for adult booster doses by the Medicines and Healthcare products Regulatory Agency (MHRA) after it was found to meet the UK regulator’s standards of safety, quality and effectiveness.
The earlier vaccine story
Here is the updated list of COVID-19 vaccines ordered by the UK. It looks as though the government has settled on the use of Pfizer and Moderna with Astrazeneca now held in reserve.
Moderna has been offered for Spring Boosters at the Three Counties Showground.
The order for Valneva has been cancelled, but nevertheless it has now been approved for use by MHRA.
Click for BBC report - Valneva Covid vaccine approved for use in UK
Nuvaxoid (Novavax) was approved in February.
The government has signed deals to buy 114 million additional doses of the Pfizer (54M) and Moderna (60M) vaccines to use in 2022 and 2023.
The press announcement goes on to say that 60M doses of Novavax vaccine are expected to be delivered in 2022 and 7.5M doses of GSK/Sanofi, so there seems no intention to cancel these late arrivals.
Click for Guardian report - Novavax expected to be become fourth Covid vaccine available in UK
| COVID-19 vaccine | Doses ordered (million) | Status |
| Pfizer BioNTech, two dose, -70 deg C | 40+60+35 | Approved, deliveries continuing, made in Belgium (EU). An additional 60M doses have been ordered for booster shots for the most vulnerable in the autumn. A further 35M doses were ordered in August 2021 for delivery in 2022. |
| Astrazeneca, two dose, fridge | 100 | Approved for those aged 30+ years; deliveries continuing. Batches made in UK, Belgium and India. |
| Moderna, two dose, -20 deg C | 7+10 | Approved. First deliveries to Wales and Scotland 7th April 2021 then England 13th April; mainly for those aged under 50 years awaiting vaccination. |
| Valneva, two dose | 60+40 order cancelled |
A jab from French company Valneva will be made in Livingston,
West Lothian, Scotland. Order cancelled September
2021. Delivery had been expected to start in second half of 2021. Approved by MHRA April 2022. |
| Janssen, single dose | 20 | Approved, a jab from Belgian firm Janssen, owned by Johnson and Johnson; UK approval 28th May. Order reduced from 30 to 20M. |
| Nuvaxovid | 60 | A jab manufactured by US firm Novavax being made in Stockton-on-Tees UK. Glaxo Smith Kline (GSK) contracted to fill and package vials. Approved by MHRA 3rd Feb 2022. JCVI to advise how vaccine will be used. |
| GSK Sanofi | 60 | Some delay due to adjusting the formula to give better protection to the elderly; expected approval and delivery of 7.5M doses in 2022. |
| Curevac | 50 ? | Contract placed with German company Feb 2021. Possible source of new variant vaccine; disappointing trial results have resulted in the company working on a second generation vaccine. Future uncertain. |
Table of vaccines ordered by the UK government
Summary of Links
Some of this information is now out of date but provides a historical context to the epidemic.
Information about Coronavirus can be found on the NHS website:
https://www.nhs.uk/coronavirus
Symptoms
Note: the list of symptoms was updated on 1st April 2022
Article about the effects of Wuhan Coronavirus on the human body
Reporting and how to obtain a test
How to get a test
https://www.nhs.uk/coronavirus
About joining the Zoe COVID Symptom Study:
Guidance
UK government Coronavirus guidance
See also - government sets out next steps for living with COVID
COVID-19 Response: Autumn and Winter Plan 2021 for England
UK Health and Security Agency (UKHSA) website
COVID Alert states
Guidance on UK COVID-19 alert level methodology: an overview
COVID-19 Alert Level lowered to 3 on 10th May 2021
Tiers
Guidance on tiers: what you need to know
Government postcode checker to find tier for other areas
Statistics
UK government COVID-19: Omicron daily overview
UK government Coronavirus Dashboard
Coronavirus Dashboard Interactive Map
ONS data on deaths in England and Wales (Excel spreadsheet)
NHS England COVID-19 Daily Deaths
NHS England COVID-19 Hospital Admissions
NHS England vaccination statistics
Worcestershire Coronavirus Dashboard
Worcestershire COVID-19 Vaccinations Dashboard
HSA COVID-19 vaccine weekly surveillance reports
Information about NHS hospital bed numbers: past, present, future
A glimpse of the worldwide vaccination situation can be found on the Our World in Data website.
Click for chart showing % vaccinated
Modelling
A forecast of the progression of the COVID-19 epidemic can be found on a University College London (UCL) website.
Click for UCL Long-term forecasting of the COVID-19 epidemic
A projection of the future COVID-19 death toll and daily deaths can be found on The Institute for Health Metrics and Evaluation website.
Click for IHME projection of COVID-19 deaths
Reports
Coronavirus (COVID-19) latest insights by ONS
A live roundup of the latest data and trends about the coronavirus (COVID-19) pandemic from the ONS and other sources.
MedRxiv is a US preprint server for Health Sciences. A depository for reports which have still to be peer reviewed.
COVID-19 rapid guideline: managing the long-term effects of COVID-19
NICE guidance on managing Long COVID
The bigger picture
Worldometer summary of coronavirus cases worldwide
European Centre for Disease Prevention and Control info
https://www.ecdc.europa.eu/en/geographical-distribution-2019-ncov-cases
World Health Organisation info
Window on the USA
Centre for Disease Control (CDC)
Find maps and charts tracking cases, deaths, and trends of COVID-19 in the United States.
American Association of Retired People (AARP)
Worcestershire
A local summary of COVID data can be found on the Worcestershire Coronavirus Dashboard.
Note 1: use the arrow <> buttons at the bottom of the Dashboard screen to move between pages.
Note 2: the figures for COVID cases are becoming meaningless as testing is run down.
Note 3: deaths are on page 7, and hospital beds on page 9.
Click for Worcestershire County Council COVID-19 news
There is a colourful webpage offering advice on learning to live with COVID for those aged under 30 years. 'Rona' is slang for Coronavirus.
Click for The Worcestershire 'Rona' Hub
Click for Simple Summary of Malvern numbers on the Coronavirus dashboard
Miscellaneous
Spanish Flu
Dr Jeff Kildea's commentary about the 1919 outbreak of Spanish Flu in Australia
Views of Martin McKee, Professor of European Public Health
Follow Martin McKee on Twitter
Views of Prof Christina Pagel, a member of Independent SAGE
Follow Christina Pagel on Twitter
SAGE membership
Scientific Advisory Group for Emergencies (SAGE)
Scottish government:
Link to Scottish Government website
Link to Postcode checker for COVID restrictions by protection level in areas of Scotland
Welsh Government:
Guidance on COVID alert levels in Wales
![]()
The interpretations and opinions expressed are our own
Last updated 4th September 2022