Angus and Rosemary's Miscellany
of Malvern - Other Resources
|
Occasional Coronavirus (COVID-19) update for Malvern SeniorsClick to read our observations on politics and world events 9th November 2023 PreambleCurrently there continues to be little to worry about If you are familiar with Excel spreadsheets, NHS England hospital admissions and beds; and deaths reported by ONS appear to be the only remaining measures of COVID-19 in the UK. Alternatively a summary of the figures can be found on the Coronavirus Dashboard which continues to be updated weekly at 4 pm on Thursdays. There is an additional source of data for COVID and Flu metrics which is a development of the Coronavirus dashboard: Here those interested should find the principal figures at the touch of a button. ContentsSummaryWith the Zoe Study stopping reporting figures, widespread monitoring of new COVID cases has ceased in the UK; the remaining metrics are daily hospital admissions, occupied beds and COVID linked deaths. The NHS reported COVID beds rising during the Autumn, peaking in England at 4,500 around 10th October 2023, but then falling, possibly due to the Autumn booster vaccination campaign. In recent days COVID beds have fallen to 3,176. COVID related deaths fell to just 65 per week in England and Wales towards the end of July but have risen during the Autumn towards 300 per week. It seems unlikely deaths will rise any higher, certainly in the short term, as the Autumn wave appears to have peaked as indicated by hospital admissions falling. The rollout of COVID Autumn boosters continues, and shots can be booked on-line at Claremont Pharmacy in Barnards Green and Evans in Malvern Link. Those aged 65 years and over, and at risk groups are eligible. These booster jabs do not appear to stop people catching COVID and we have heard of several cases amongst our friends in Malvern. If you catch COVID it is likely to be a mild illness, though you might feel quite poorly and be left feeling very tired. However the unlucky few might suffer breathing difficulties and become severely ill. (Definitions: mild = treatable at home; severe = treated in hospital). Typically sufferers report feeling very poorly for about 2 weeks, and are left feeling very tired. A breast cancer patient reports it took 3 months to get over COVID. Currently there are only between 1 and 2 COVID related deaths per week in the Malvern Hills district. What happens if you get sick with COVIDIf you are feeling poorly it might not be COVID-19 but some other respiratory illness. Whatever the virus best stay at home until you feel better, and wear a face mask to protect others if you do have to go out. You can test for COVID at home using Lateral Flow Self-Testing Kits. These are no longer free but additional kits can be purchased from pharmacies. Those who have caught COVID report feeling hot and cold but unable to get warm, and either getting easily tired or suffering from shortness of breath for some weeks afterwards. Patients are advised to take it easy until fully recovered. There are very few cases of Flu at the present time. PrecautionsThe majority are not taking precautions relying on vaccination to protect against serious illness; those catching COVID often have little idea of where or who they caught it from. Vaccination SitesThe situation seems to vary at different Malvern Town Surgeries. We were told by our Surgery boosters were not expected until mid October. A few days after receiving a text message inviting us to book a jab we were told there were no more appointments, so we had to use the NHS online booking service to get jabs at Claremont Pharmacy in Barnards Green. You can book on-line for example at either Claremont Pharmacy in Barnards Green, Evans Pharmacy in Malvern Link or Upton Surgery at Tunnel Hill, Upton-upon-Severn. Click to book, cancel or change a COVID-19 vaccination appointment Number of casesWidespread monitoring of daily COVID cases has ceased in the UK. Number of deathsONS figuresThe Office of National Statistics (ONS) reports registered deaths in England and Wales where COVID-19 is mentioned somewhere on the death certificate. The ONS figures lag real time by 10 - 14 days due to the administrative delay in submitting and processing reports, and do not include Northern Ireland and Scotland. Note: the figures include cases where COVID may have been a secondary cause of death. Click for ONS data on deaths (Excel spreadsheet) ONS figures for Worcestershire by date reportedThe ONS figures can be filtered by Local Authority providing a glimpse of where deaths are occurring. The provisional cumulative total of COVID related deaths in Worcestershire reported by the ONS on 7th November (week 43 of 2023) is shown in the table below. Note: these numbers are derived from Table 1 of the ONS Death Registrations spreadsheet using the in-built filters. This gives the provisional total of deaths registered in any week, which can be distorted by delayed reporting, for example, due to public holidays. Deaths by Welsh Health Boards are excluded to avoid duplication as these are totals of Local authorities.
Provisional cumulative COVID-19 deaths in Worcestershire registered by ONS reported on 7th November 2023.
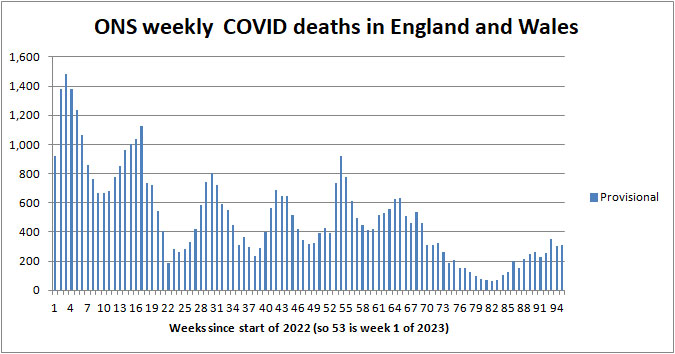
ONS figures for England and Wales by date reportedIn England and Wales 314 COVID-19 related deaths were reported in week 43.
ONS provisional deaths 'by week reported' in England and Wales since the start of 2022 (so week 53 is week 1 of 2023) The chart suggests weekly deaths may be peaking, following COVID beds peaking around 10th October. Averaged over recent years roughly 11,900 people die weekly from all causes in the UK so currently COVID deaths are about 3% of all deaths. Risk of COVID-19 death by age bandNHS England provides an analysis of COVID-19 deaths in hospital in England and Wales by age band. Shown below is a snapshot of 2,898 deaths for the period 6th May 2022 to 6th July 2022 when most of these deaths will have been from the Omicron variants.
Relative risk of COVID-19 death by age band May - July 2022 The main point to note is those aged 60+ account for 93% of deaths despite young people being more likely to catch COVID-19. The risk profile for Omicron appears to be the same as for Delta. Age is still the greatest risk factor; perhaps reflecting that older people have more health problems. According to the Coronavirus Dashboard sex is an additional risk factor - males are roughly 50% more likely to die than women; possibly because women have a stronger immune system.
|
| Region | 21st September 2023 | 5th November 2023 | 15th January 2021 | |
| England | 3,019 | 3,176 | 33,362 | |
| London | 535 | 482 | 7,811 | |
| Midlands | 597 | 651 | 5,890 |
Comparison of All beds COVID data for England, London and Midlands
COVID beds in England peaked at 4,500 around 10th October and the number of beds occupied by COVID patients is currently falling.
For comparison, the number of beds occupied during the peak of the epidemic in January 2021 is shown in red in the right hand column of the table.
Also see charts on the Coronavirus Dashboard
Worcestershire hospital beds
Click for Summary of Malvern numbers on the Coronavirus dashboard
The Worcestershire Coronavirus dashboard has been retired.
Forecast for the week ahead
No great change is expected during the next week or so.
Longer term outlook
As people spend more time indoors, as the weather gets colder, new daily cases of COVID-19 could rise a little with hospital bed occupancy possibly falling in the range 3,000 to 5,000 in England by Christmas.
What happens with regard to deaths will largely depend on the take-up of Autumn boosters by the elderly. Currently it looks as though most of those who are going to get a booster have already had it, so perhaps COVID cases are soon going to stop falling and could rise a bit as families spend more time indoors. Our guess is that, in the worst case, COVID deaths in England could rise towards 400 per week between now and Christmas, but that would remain only 3% or so of all deaths and few are likely to worry about that.
Advice for Seniors
Apart from the Autumn booster programme, the government seems to have largely washed its hands of COVID considering it to be just one of many viruses in circulation. Little or no recent statistical information about the benefits of booster vaccinations and the health risks posed by the latest variants in circulation has been published. One can therefore only make broad suggestions.
The risk of exposure to COVID-19 seems quite high in Malvern at present, but there is no evidence that COVID is currently causing alarming numbers of people in Worcestershire to fall severely ill; so for most, the risk might perhaps be considered LOW.
Consequently our riskometer currently remains at LOW (see opposite).
Most healthy people seem to be taking the view that COVID is no longer a critical threat to their health.
For the more cautious the simple safeguards to protect against all respiratory infections are to:
-
make sure vaccinations are up to date, noting Flu and COVID booster jabs for those aged 65+ years are expected to be available until December 2023.
-
wash HANDS thoroughly, using soap and hot water, for 20 seconds, including after handling deliveries to your home, to kill virus picked up from contaminated surfaces (see note 1);
-
ideally wear either a well fitting FACE covering, or better still an FFP2 (N95) face mask when in crowded settings for example when in shops, theatres, health-care settings, when using public transport, and travelling by air;
-
SPACE at least 2 metres from people you don't feel safe with (see note 2); remember when people are at their most infectious they do not show symptoms.
-
preferably socialise with friends and other households outdoors in the FRESH AIR else, if you are indoors, either ventilate by keeping windows open as far as is practicable or consider putting a HEPA air purifier in the room;
-
avoid crowded indoor settings, people shouting and singing, and friends and colleagues with cold and flu like symptoms;
-
stay at home to protect others if you yourself feel unwell with cold or flu like symptoms;
-
respect others and give them space;
Notes:
1) Wash your hands thoroughly before touching your face to avoid transferring virus from contaminated surfaces to your mouth, eyes and nose. If outdoors, for example filling the car up with fuel, either wash hands with an alcohol based hand gel after touching suspect surfaces or wear gloves.
2) Two metres is further than you think - roughly an arm and a walking stick away.
3) If you are 'clinically vulnerable' consult your GP or specialist; you may need to take a test and consider anti viral drugs if testing positive.
Annex
Commentary
Severe cases of COVID-19 went up a bit in the Autumn leading to more patients in hospital, and a rise in COVID related deaths.
Hospital admissions then fell in the second half of October, following the roll out of Autumn boosters, suggesting the boosters may be reducing severe illness in those aged 65+ years, and possibly lowering transmission.
Dr John Campbell's videos
Dr John Campbell is still producing health related videos sometimes challenging accepted points of view.
In one video Professor David Anderson puts forward the view keeping up Vitamin D3 levels is important for maintaining a healthy immune system. He suggests supplementation with 5,000 IU of Vitamin D3 daily could be beneficial, which is 25 times the RDI.
Click for chat with Prof David Anderson
In another video Professor Angus Dalgleish puts forward the theory that vaccination while defending against the one disease just might possibly lower immunity to other diseases.
Cancer after vaccines with Professor Dalgleish
Interesting, but we don't know whether there is any substance to these claims.
Independent SAGE
The next Independent SAGE fortnightly update is expected on 17th November 2023.
You can watch the last briefing by clicking the link below.
Click to watch Independent SAGE update on 3rd November 2023
A discussion on Long COVID, vaccines and variants, with guests Ryan Hisner and Alexandra Tabachnikova, hosted by Prof Steve Griffin; and numbers by Dr Kit Yates.
List of vaccines
Section deleted. Refer to archived pages for historical information about vaccines.
Summary of Links
Some of this information is now out of date but provides a historical context to the epidemic.
Information about Coronavirus can be found on the NHS website:
https://www.nhs.uk/coronavirus
Symptoms
Note: the list of symptoms was updated on 1st April 2022
Article about the effects of Wuhan Coronavirus on the human body
Reporting and how to obtain a test
How to get a test
https://www.nhs.uk/coronavirus
About joining the Zoe COVID Symptom Study:
Guidance
UK government Coronavirus guidance
See also - government sets out next steps for living with COVID
COVID-19 Response: Autumn and Winter Plan 2021 for England
UK Health and Security Agency (UKHSA) website
COVID Alert states
Guidance on UK COVID-19 alert level methodology: an overview
COVID-19 Alert Level lowered to 3 on 10th May 2021
Tiers
Guidance on tiers: what you need to know
Government postcode checker to find tier for other areas
Statistics
The UKHSA data dashboard (new source of data on COVID and Flu)
UK government COVID-19: Omicron daily overview
UK government Coronavirus Dashboard
Coronavirus Dashboard Interactive Map
ONS data on deaths in England and Wales (Excel spreadsheet)
NHS England COVID-19 Daily Deaths
NHS England COVID-19 Hospital Admissions
NHS England vaccination statistics
Worcestershire Coronavirus Dashboard
Worcestershire COVID-19 Vaccinations Dashboard
HSA COVID-19 vaccine weekly surveillance reports
Information about NHS hospital bed numbers: past, present, future
A glimpse of the worldwide vaccination situation can be found on the Our World in Data website.
Click for chart showing % vaccinated
A video with Dr John Campbell and mathematician Professor Fenton explaining the various ways in which RISK can be specified.
Risks and benefits with Professor Fenton
Modelling
A forecast of the progression of the COVID-19 epidemic can be found on a University College London (UCL) website.
Click for UCL Long-term forecasting of the COVID-19 epidemic
A projection of the future COVID-19 death toll and daily deaths can be found on The Institute for Health Metrics and Evaluation website.
Click for IHME projection of COVID-19 deaths
Reports
Coronavirus (COVID-19) latest insights by ONS
A live roundup of the latest data and trends about the coronavirus (COVID-19) pandemic from the ONS and other sources.
MedRxiv is a US preprint server for Health Sciences. A depository for reports which have still to be peer reviewed.
COVID-19 rapid guideline: managing the long-term effects of COVID-19
NICE guidance on managing Long COVID
The bigger picture
Worldometer summary of coronavirus cases worldwide
European Centre for Disease Prevention and Control info
https://www.ecdc.europa.eu/en/geographical-distribution-2019-ncov-cases
World Health Organisation info
Window on the USA
Centre for Disease Control (CDC)
Find maps and charts tracking cases, deaths, and trends of COVID-19 in the United States.
American Association of Retired People (AARP)
Worcestershire
A local summary of COVID data can be found on the Worcestershire Coronavirus Dashboard.
Note 1: use the arrow <> buttons at the bottom of the Dashboard screen to move between pages.
Note 2: the figures for COVID cases are becoming meaningless as testing is run down.
Note 3: deaths are on page 7, and hospital beds on page 9.
Click for Worcestershire County Council COVID-19 news
There is a colourful webpage offering advice on learning to live with COVID for those aged under 30 years. 'Rona' is slang for Coronavirus.
Click for The Worcestershire 'Rona' Hub
Click for Simple Summary of Malvern numbers on the Coronavirus dashboard
Miscellaneous
Spanish Flu
Dr Jeff Kildea's commentary about the 1919 outbreak of Spanish Flu in Australia
Views of Martin McKee, Professor of European Public Health
Follow Martin McKee on Twitter
Views of Prof Christina Pagel, a member of Independent SAGE
Follow Christina Pagel on Twitter
SAGE membership
Scientific Advisory Group for Emergencies (SAGE)
Scottish government:
Link to Scottish Government website
Link to Postcode checker for COVID restrictions by protection level in areas of Scotland
Welsh Government:
Guidance on COVID alert levels in Wales
Bibliography
Woolhouse, Professor Mark, The Year the World went Mad, published 2022 by Sandstone Press Ltd, ISBN: 978-1-913207-94-3
Medinger Dez, Altmann Danny, The Long Covid Handbook, Penguin Books, 2022. Kindle version available.
![]()
The interpretations and opinions expressed are our own
Last updated 12th November 2023