Angus and Rosemary's Miscellany
of Malvern - Other Resources
|
Coronavirus (COVID-19) epidemic weekly update for Malvern Seniors14th March 2021 COVID LOCKDOWN in ENGLAND - LEVEL 1 Alert Level dropped to 4 on February 25th DAILY INFECTION RATE FALLING PM says 'STAY AT HOME' Skip to menu of archived pages PreambleWe keep an eye on the published government figures to asses the level of risk in the Malvern Hills district, if there is an uptick in cases we will tell you. This page is updated every Sunday between 1800 and 2400 hours GMT. Information about Coronavirus can be found on the NHS website: https://www.nhs.uk/coronavirus
|
 How
to request a test
How
to request a test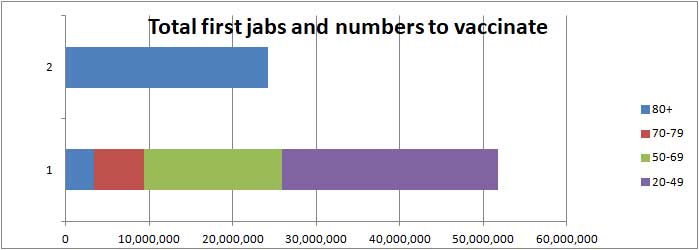
| Districts of Worcs | Cases | Weekly increase | Population |
| Bromsgrove | 6,094 | +43 | 98,529 |
| Malvern Hills | 2,716 | +32 | 77,545 |
| Redditch | 5,962 | +129 | 85,317 |
| Worcester | 5,903 | +52 | 103,542 |
| Wychavon | 6,253 | +71 | 126,240 |
| Wyre Forest | 5,365 | +102 | 100,957 |
| TOTAL | 32,293 | +429 | 592,130 |
| COMPARE WITH | |||
| County of Hereford | 6,679 | +60 | 195,000 |
| Leicester (city of) | 34,422 | +414 | 400,000 |
Cumulative cases reported by PHE in Worcestershire to 14th March 2021
Interactive map
At the bottom of the Coronavirus Dashboard (daily update) page there is an Interactive Map which is coloured to show the variation in infection rate across the country. The green areas show how the rate of infection has fallen steadily across the UK since the start of the lockdown.
Click for Interactive Map of COVID cases
Note: the Interactive Map works on desktop PCs but it's possible you may encounter difficulties using a tablet or smartphone.
Recent weekly cases to 9th March are: North Malvern 6; Malvern Link 3; Pickersleigh <3; Barnards Green 10; Malvern Wells and Priory <3; Callow End and Hanley 4; Upton and Welland <3. The picture changes daily.
Number of deaths
Statistics on COVID deaths are published by Public Health England, The Office of National Statistics, and NHS England; these show the third wave daily death rate has passed its peak and begun to fall.
PHE figures
Public Health England reports that the cumulative total of COVID (28) deaths in UK hospitals and care homes has risen by 1,015 in the last week to 125,516 while the daily average has fallen from 211 to 145; see chart below which shows the actual daily death rate in red, and our new forecast to 16th April in blue.
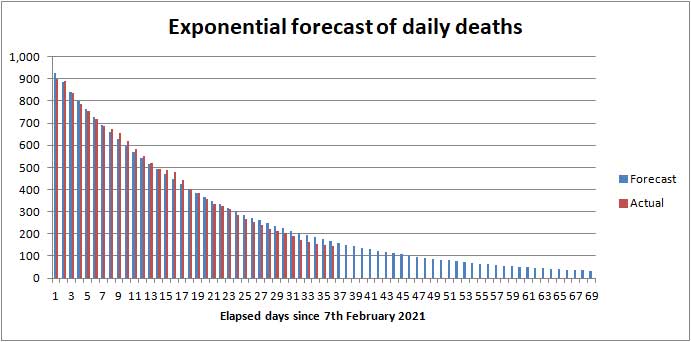
Daily UK death rate from 7th February to 14th March 2021 in red
Forecast to 16th April in blue
The forecast is based on an exponential function multiplied by a factor to take account of vaccinations.
Click to view the UK government Coronavirus Dashboard
In comparison averaged over recent years 1,700 people die daily from all causes.
ONS figures
The Office of National Statistics (ONS) separately reports registered deaths in England and Wales where COVID-19 is mentioned on the death certificate. The ONS figures lag the PHE figures by 10 - 14 days and do not include NI and Scotland.
The ONS figures are broken down by District providing a glimpse of where deaths are occurring. The cumulative total of COVID related deaths in Worcestershire reported by the ONS up to 26th February 2021 (week 8 of 2021) is shown below.
| Districts of Worcs | Deaths 2020 |
Deaths 2021 |
Weekly increase | Population |
| Bromsgrove | 164 | 87 | +2 | 98,529 |
| Malvern Hills | 61 | 75 | +8 | 77,545 |
| Redditch | 108 | 70 | +5 | 85,317 |
| Worcester | 87 | 98 | +5 | 103,542 |
| Wychavon | 157 | 101 | +4 | 126,240 |
| Wyre Forest | 171 | 80 | +6 | 100,957 |
| TOTAL | 748 | 511 | +30 | 592,130 |
Cumulative COVID deaths registered by ONS to 26th February 2021
In the week ending 26th February 30 COVID related deaths in Worcestershire were reported.
In total in England and Wales 2,388 COVID related deaths were reported by the ONS in the week to 26th February, a fall of almost 50% on the week before.
The highest number of hospital deaths (>19) by Lower Tier Local Authority were:
Bournemouth Christchurch and Poole 20, Buckinghamshire 35, Barnsley 32, Birmingham 52, Sandwell 28, Walsall 24, Leeds 36, Cardiff 23, Cardiff and Vale University Health Board 32.
The cumulative total of COVID related deaths in England and Wales recorded by the ONS for all weeks of the epidemic rose to about 135,000.
| Year | Cumulative COVID related deaths in England and Wales |
| 2020 | 85,686 |
| 2021 | 49,366 |
| TOTAL | 135,052 |
COVID death toll in England and Wales to 26th February 2021 (source: ONS)
Note: an error in transcription has been corrected using the ONS figures published on 16th March. Consequently there is a discontinuity with last week's numbers.
Click for national ONS data on deaths (Excel spreadsheet)
NHS England figures
More recently in the seven days ending 14th March NHS England reported the cumulative total of deaths in Worcestershire hospitals rose by 15 to 852.
Click for NHS COVID-19 Daily Deaths
Healthcare numbers
The UK government Coronavirus Dashboard includes important information about healthcare statistics.
| Hospital cases (UK) | Number | Weekly change |
| Patients currently in hospital | 8,029 | -2,869 |
| Patients on ventilation | 1,110 | -432 |
| Patients admitted daily | 563 | -144 |
Headline summary of patients in hospital as reported 14th March 2021
These headline figures show the number of COVID patients in hospital has continued to fall and is now 20% of the peak.
The number of patients on ventilators is gradually falling.
Daily admissions are down again. The steady state number of COVID patients in hospital seems to be roughly ten time the number of patients admitted daily, suggesting a fall to 5,600 patients is on the way.
Tabulated figures for bed occupancy in Worcestershire Acute and Care hospitals can be found on the NHS England website, but it is quicker to look at a graph at the bottom of the Worcestershire Coronavirus Dashboard homepage which shows at a glance the number of beds occupied by COVID patients in Worcestershire Acute hospitals.
Click for NHS England COVID-19 Hospital bed Activity
Click for Worcestershire Coronavirus Dashboard
Notes on projected figures for deaths
Statistician Sir David Spiegelhalter of Cambridge University speaking on BBC TV last year said that, using his rule of thumb, hospital admissions were likely to be about 10% of reported new cases, one week after symptoms; and deaths were likely to be about 2% of new cases, 2 to 3 weeks after that - which would point to about 110 deaths per day in UK hospitals by the end of March.
Once a large proportion of the population has been vaccinated this rule of thumb will no longer apply, and COVID deaths as a percentage of new cases should fall sharply.
Forecast for the week ahead
Trends suggest that during the next seven days (up to 21st March) the cumulative total of new UK COVID-19 cases reported by PHE on the Coronavirus Dashboard could increase by about 40,000 towards 4,300,000.
In Worcestershire up to 420 new cases of COVID-19 can be expected, and possibly up to 40 cases in the Malvern Hills district.
We estimate the number of COVID (28) deaths could increase by about 870 nationally towards 126,400 during the 7 days ending 21th March 2021.
In the county of Worcestershire, assuming a 2.4% death rate, the 429 new cases this week could translate to about 10 Worcestershire deaths per week by the end of March, but if cases are mostly confined to younger age groups it could be less.
Longer term forecast
It is once again impossible to provide a long term forecast this week due to uncertainty about how much the relaxation of government restrictions and the behaviour of the public will put up the Effective Reproduction Rate of the virus, and how effective the vaccines will be at reducing the transmission of COVID-19. The best we can do is speculate about what might happen.
Rapid rollout of the vaccine, frequent testing of school children and their families, hand washing, masks, and physical distancing could keep COVID under control during STEP 1A of the exit from lockdown - it should be clear whether or not this is the case by the end of March.
By mid April half the population should have been vaccinated. Now we have seen no official estimate of the basic reproduction rate of the Kent virus, but were it to be as high as 5, vaccination alone would only reduce the effective reproduction rate to 2.5 and so the wearing of masks and physical distancing beyond April could still be needed, possibly up to and beyond the ending of the third lockdown in June.
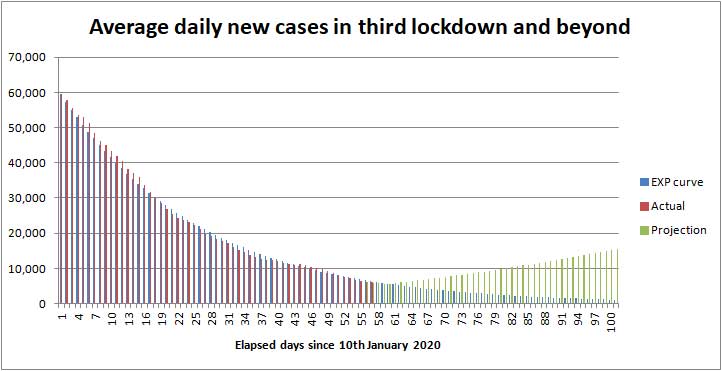
Projected new daily cases to 20th April 2021
The chart above shows the declining number of daily new cases in red and a falling exponential curve which was our forecast 4 weeks ago, in blue, (assuming R<1).
The green projection is an illustration of what might happen if R rises a little above one causing daily cases to rise at a rate half that of the third wave. An adjustment has been made for vaccination, including take up of the vaccine (85% allowing for those under 18), and effectiveness (80%). Based on these assumptions you will see towards the end of April new daily cases could either fall to 1,000 a day in the very best case (R<1), or rise towards 15,000 (R>1).
By next Sunday 21st March the chart suggests the average number of daily new cases should lie in the range 3,600 to 7,700 (mean value = 5,650).
If the vaccine breaks the link with hospitalizations and deaths then such figures may be of no great concern. Like the government, we'll just have to wait and see what happens during the next fortnight.
The death toll will continue to mount until the vaccination programme eventually draws the UK COVID-19 epidemic to a close. We currently expect the UK COVID death toll to reach 129,000 by the end of April 2021; see commentary.
Exactly what happens will depend on how carefully the government relaxes the restrictions, the effectiveness of test and trace, any change in the lethality of new variants of the virus, and most importantly the speed of the vaccine rollout.
Advice for Seniors
 The
daily number of new cases of Coronavirus has fallen a long way from
the peak, so we judge the
risk MODERATE for Seniors living in the
Malvern Hills district who have not been vaccinated; see our annex and riskometer opposite.
The
daily number of new cases of Coronavirus has fallen a long way from
the peak, so we judge the
risk MODERATE for Seniors living in the
Malvern Hills district who have not been vaccinated; see our annex and riskometer opposite.
The risk could be approaching LOW for most Seniors who have been jabbed more than 3 weeks ago.
Remember if you have not been vaccinated and catch COVID there is a significant chance that you will either die or your long term health may be seriously damaged, so continue to take care to protect yourself and those you love. 90% of COVID deaths are in those aged over 60 years according to NHS England statistics.
Click for our risk of death table
When it is your turn to be offered the jab you should grasp the opportunity with both hands.
The simple safeguards to remember are still to:
-
wash your HANDS thoroughly, using soap and hot water, for 20 seconds, including after handling deliveries to your home, to kill virus picked up from contaminated surfaces see note 1;
-
wear a FACE mask when unavoidably near other people for example when shopping, visiting hospital or the chemist;
-
SPACE at least 2 metres apart from others see note 2;
-
keep TIME near others as short as possible, see note 3;
-
self-isolate and book a test if you have COVID-19 symptoms (new continuous cough, fever or loss of, or change in, sense of smell or taste).
Hence the mantra:-
HANDS, FACE, SPACE, TIME - GET A TEST if you feel unwell.
Pulse Oximeter
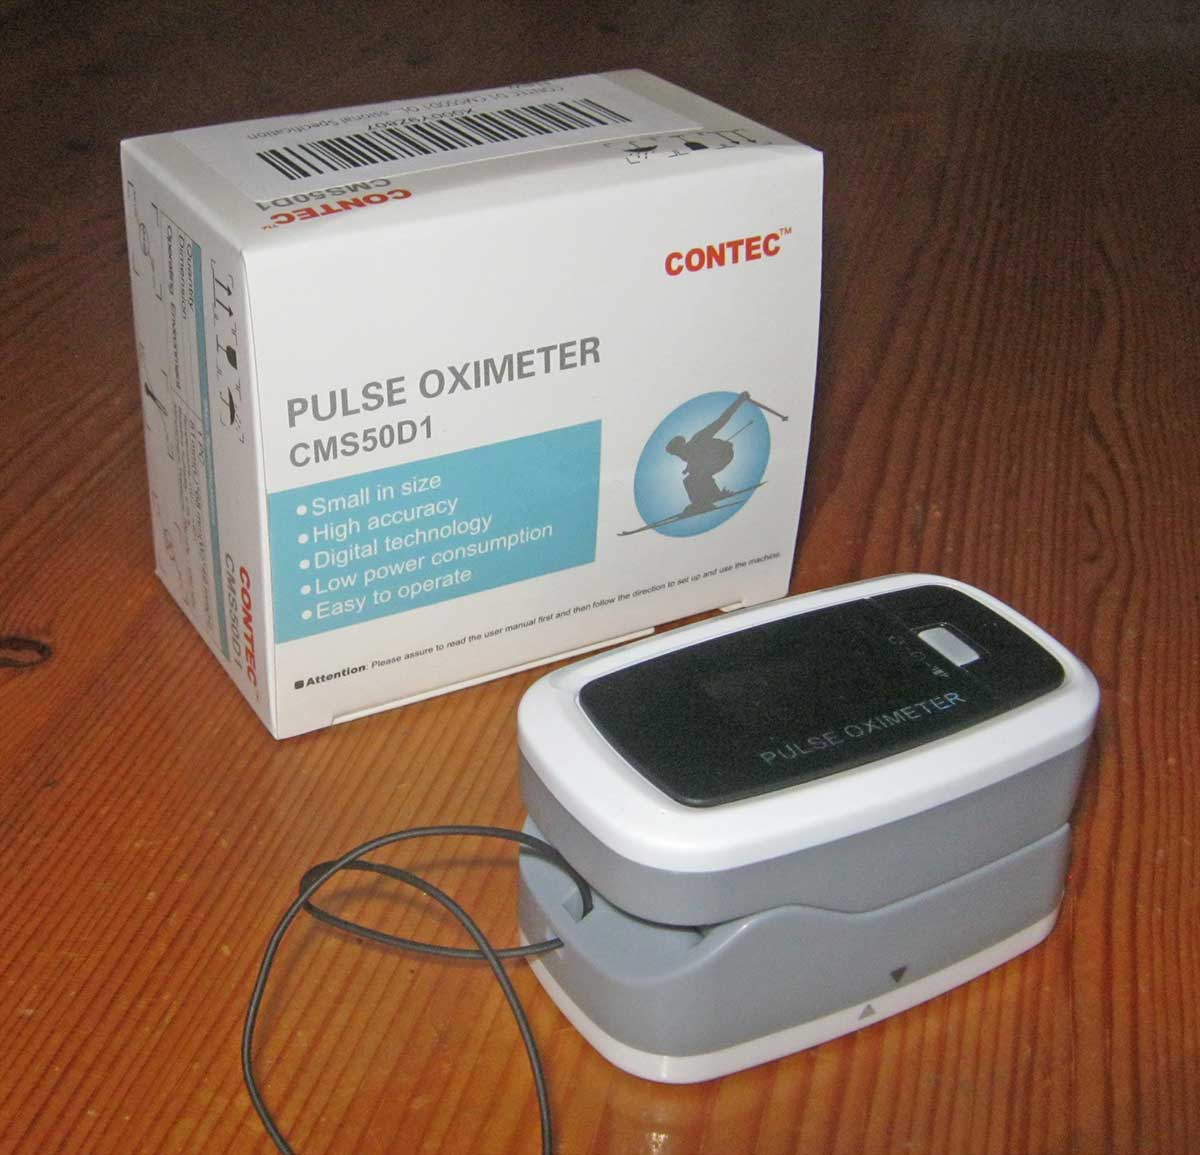 A
doctor in Bournemouth speaking on the evening news suggested
that if you were sick with COVID at home it would be a good idea to have a
little device known as a Pulse Oximeter handy (see photo on right). This
measures the oxygen saturation in the blood and pulse rate by clipping the
device on a finger and pressing a button; the reading should normally be at
least 97%.
A
doctor in Bournemouth speaking on the evening news suggested
that if you were sick with COVID at home it would be a good idea to have a
little device known as a Pulse Oximeter handy (see photo on right). This
measures the oxygen saturation in the blood and pulse rate by clipping the
device on a finger and pressing a button; the reading should normally be at
least 97%.
If the reading falls to about 93% you should call your doctor for advice, and if the reading is consistently below 92% you should consider calling an ambulance or visiting A&E.
Pulse Oximeters can be purchased from Amazon for £18 to £25; alternatively your doctor's surgery might loan you one if you are unwell and have tested COVID positive.
Remember, if you have symptoms of COVID-19 at home and can't count from one to ten out loud due to shortness of breath, you should immediately call your GP, 111 or 999 for advice.
Click for UK government Coronavirus guidance on what you can and cannot do
Notes:
1) Wash your hands thoroughly before touching your face to avoid transferring virus from contaminated surfaces to your mouth, eyes and nose. If outdoors use hand gel.
2) Two metres is further than you think - roughly an arm and a walking stick away.
3) During the National Lockdown you should not mix with other households.
Minimise exposure time if you unavoidably find yourself mixing in a confined setting - an invisible mist of virus can build up in the air if the space is shared with an infectious person; imagine people exhaling cigarette smoke. Unless you wear a well fitting FFP3 hospital grade face mask you can breath this in; a face covering will offer little protection. The likelihood and extent you get sick will depend on the density of the airborne virus, which can be reduced by ventilation, and the duration of your exposure.
Annex to 14th March update
Commentary
Daily deaths and hospital admissions continue to fall.
This is the end of the first week of STEP 1A of the release from the lockdown with children returned to school. It's now a waiting game to see if, during the remainder of March, daily cases continue to fall exponentially (R<1) or start rising due to increased mixing.
The PM gave a press briefing on Monday about the first step out of lockdown and children returning to school.
There is speculation overseas travel won't be allowed before May 17th.
The Malvern Gazette reports that COVID lateral flow tests will be available from Great Malvern Library.
Vaccines
The target is to vaccinate all those aged 50 - 69 by the 15th April, while for the next two months the priority must be giving second jabs to those aged 70+ years; obviously the government think there will be enough vaccine to jab both cohorts.
The target for vaccination of those aged 18-49 has been brought forward to the end of July 2021 and this will be facilitated by the mass vaccination centre at The Three Counties Showground which is now up and running. There is speculation in the media the target may be met earlier.
Those aged 56+ should be getting a letter from the NHS in the next few days. We have been told that sessions at the Three Counties run till 8 pm and appointments for first jabs can be booked one to two weeks ahead, with the second jab about 12 weeks later. If you select a slot, click to confirm it quickly before someone else takes it. The availability of slots can be expected to vary daily depending on vaccine availability so keep trying.
Those newly designated vulnerable may get a text message in the next few days with information on how to obtain a jab.
Here is a list of the vaccines ordered by the UK.
| COVID-19 vaccine | Doses ordered (million) | Status |
| Pfizer BioNTech, two dose, -70 deg C | 40 | Approved, delivery has started, made in Belgium |
| Astrazeneca, two dose, fridge | 100 | Approved, delivery has started after some delay, made in UK |
| Moderna, two dose, -20 deg C | 7+10 | Approved, could be available in May, supplied from either Switzerland or Spain. |
| Valneva, two dose | 60+40 | A jab from French company Valneva will be made in Livingston, West Lothian, Scotland. Delivery to start in second half of 2021. |
| Janssen, single dose | 30 | A jab from Belgian firm Janssen, owned by Johnson and Johnson; phase III trials complete. Approved for use in the USA and EU; possibly available from May. |
| Novavax | 60 | A jab manufactured by US firm Novavax will be made in Stockton-on-Tees; phase III trials complete, could be available later this year. |
| GSK Sanoft | 60 | Some delay due to adjusting the formula to give better protection to the elderly; possible availability late 2021. |
| Curevac | 50 | Contract placed with German company Feb 2021. Possible source of new variant vaccine later in 2021 |
Table of vaccines ordered by the UK government
Recent deaths in Worcestershire hospitals
The table below shows all COVID deaths in Worcestershire hospitals reported by NHS England to 13th March.
| Worcestershire | Cumulative deaths | Weekly increase |
| Acute hospitals | 789 | +14 |
| Care hospitals | 63 | +1 |
| TOTAL | 852 | +15 |
In the last week 15 additional deaths have been recorded compared to 12 the week before.
Present rate of new cases
This week, the average rate of infection per 100,000 population per week in England fell from 70 to 59. In comparison the figure for Worcestershire is 73 and that in the Malvern Hills 53.
The probability of catching Coronavirus is now relatively low, but combined with the significant risk of death makes us view the overall risk to Seniors, prior to inoculation, as falling towards MODERATE.
The risk of death from Coronavirus for healthy teenagers is exceedingly small so for them the risk is VERY LOW, whereas the middle aged can suffer from debilitating Long COVID so for them the risk might be assessed somewhere between LOW and MODERATE.
Forecast of death rate during March and April
The average UK COVID daily death rate has been falling steadily since 25th January due to physical distancing and in coming weeks the vaccination programme should lead to a slightly faster fall in the death rate with deaths possibly tailing off to 70 deaths per day or less by the end of March.
The rolling 7 day average death rate was 145 deaths per day on 14th March. Assuming the death rate falls linearly to 72 deaths per day by the end of March, then there could be up to 1,845 further deaths in March, and if the death rate fell to 16 deaths per day by the end of April, another 1,320 deaths in April.
Adding these 'back of the envelope' numbers suggests the UK COVID-19 death toll could reach 128,681 by the end of April.
| Date | Forecast UK COVID-19 death toll (PHE basis) |
| March 14th | 125,516 |
| March 31st | +1,845 |
| April 30th | +1,320 |
| Total | 128,681 |
Forecast UK COVID-19 epidemic death toll by the end April 2021
Another projection of the future COVID-19 death toll and daily deaths can be found on The Institute for Health Metrics and Evaluation website:
Click for IHME projection of COVID-19 deaths
The latest projection is for 148,900 deaths by the end of April which probably won't be far off the figure reported by the ONS.
At the start of the epidemic in March the Chief Scientific Adviser, Sir Patrick Valance, suggested a death toll of 20,000 would be a good outcome; on the other hand, Professor Neil Ferguson of Imperial College warned in some scenarios the death toll might be as high as 250,000; while we thought, in the very worst case assuming up to 1% of the UK population died the outcome might have been nearer 400,000 taking into account some build up of herd immunity.
So how well will the UK have done? When Sir Patrick Valance spoke off the top of his head there had been few deaths and he clearly did not want to 'scare the horses'. Professor Neil Ferguson was nearest the mark. A few might consider an outcome of 129,000 deaths a fair result compared to a greater number of people dying in a very short space of time, more being permanently disabled by Long COVID, and temporary collapse of the NHS. Members of the Labour Party and others will no doubt say the UK has done very poorly compared to the best performing countries such as Australia, New Zealand and Singapore where deaths have been much lower, not to mention the enormous expense of supporting those out of work and huge damage to the economy.
Ultimately there can be no winners or losers, but there must be a thorough inquiry to learn lessons for the future.
Summary of Links
Symptoms
Article about the effects of Coronavirus on the human body
Reporting and how to obtain a test
How to get a test
https://www.nhs.uk/coronavirus
About joining the Zoe COVID Symptom Study:
Guidance
UK government Coronavirus guidance
Tiers
Guidance on tiers: what you need to know
Government postcode checker to find tier for other areas
Statistics
UK government Coronavirus Dashboard
Coronavirus Dashboard Interactive Map
ONS data on deaths in England and Wales (Excel spreadsheet)
NHS England COVID-19 Daily Deaths
NHS England COVID-19 Hospital Admissions
NHS England vaccination statistics
Reports
ONS Coronavirus (COVID-19) Roundup
The bigger picture
Worldometer summary of coronavirus cases worldwide
European Centre for Disease Prevention and Control info
https://www.ecdc.europa.eu/en/geographical-distribution-2019-ncov-cases
World Health Organisation info
Window on the USA
Centre for Disease Control (CDC)
American Association of Retired People (AARP)
Worcestershire
Help:
http://www.worcestershire.gov.uk/here2help
Worcestershire County Council COVID-19 information:
http://www.worcestershire.gov.uk/coronavirus
Here you will find a useful link,
'Website: Number of new cases by date in Worcestershire'
which displays interesting COVID charts and statistics for Worcestershire
Miscellaneous
Spanish Flu
Dr Jeff Kildea's commentary about the 1919 outbreak of Spanish Flu in Australia
Views of Martin McKee, Professor of European Public Health
Follow Martin McKee on Twitter
SAGE membership
Scientific Advisory Group for Emergencies (SAGE)
Scottish government:
Link to Scottish Government website
Link to Postcode checker for COVID restrictions by protection level in areas of Scotland
Welsh Government:
Guidance on COVID alert levels in Wales
![]()
The interpretations and opinions expressed are our own
Last updated 16th March 2021