Angus and Rosemary's Miscellany
of Malvern - Other Resources
|
Coronavirus (COVID-19) epidemic weekly update for Malvern Seniors14th November 2021 GET VACCINATED AND TAKE CARE AS VIRUS STILL WIDESPREAD Skip preamble and go to summary Skip to menu of archived pages PreambleWe keep an eye on the published government figures and monitor the media to asses the level of risk for Seniors in the Malvern Hills district. We also provide links to where further information can be found. This page is normally updated every Sunday between 1800 and 2400 hours GMT. Information about Coronavirus can be found on the NHS website: https://www.nhs.uk/coronavirus How to get vaccinatedThe most important thing everyone can do now is get vaccinated. Most Seniors should have been double jabbed months ago, but if not get your vaccine, and encourage your friends and loved ones to get theirs. The effectiveness of the vaccines falls over time so remember to get your booster shot six months after your second jab. You should get a reminder either from the NHS or your GP surgery; this could be by letter, or a text message if you have registered a mobile phone number. Boosters can now be had without an appointment at the Three Counties Show Ground. See the NHS website for opening times and vaccine availability: Alternatively try booking an appointment at your GP surgery. Note: the immuno-suppressed may be offered a third jab as part of their primary course, followed by a booster later.
|
 How
to request a COVID test
How
to request a COVID test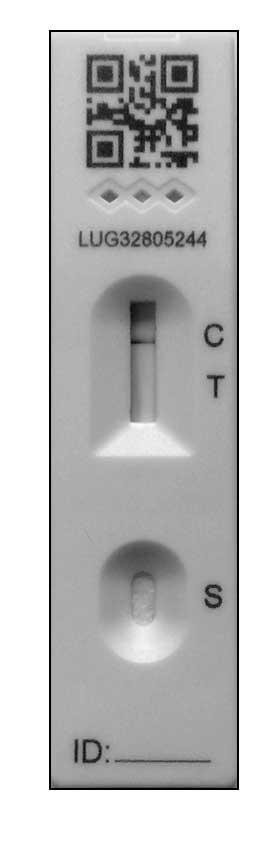 You
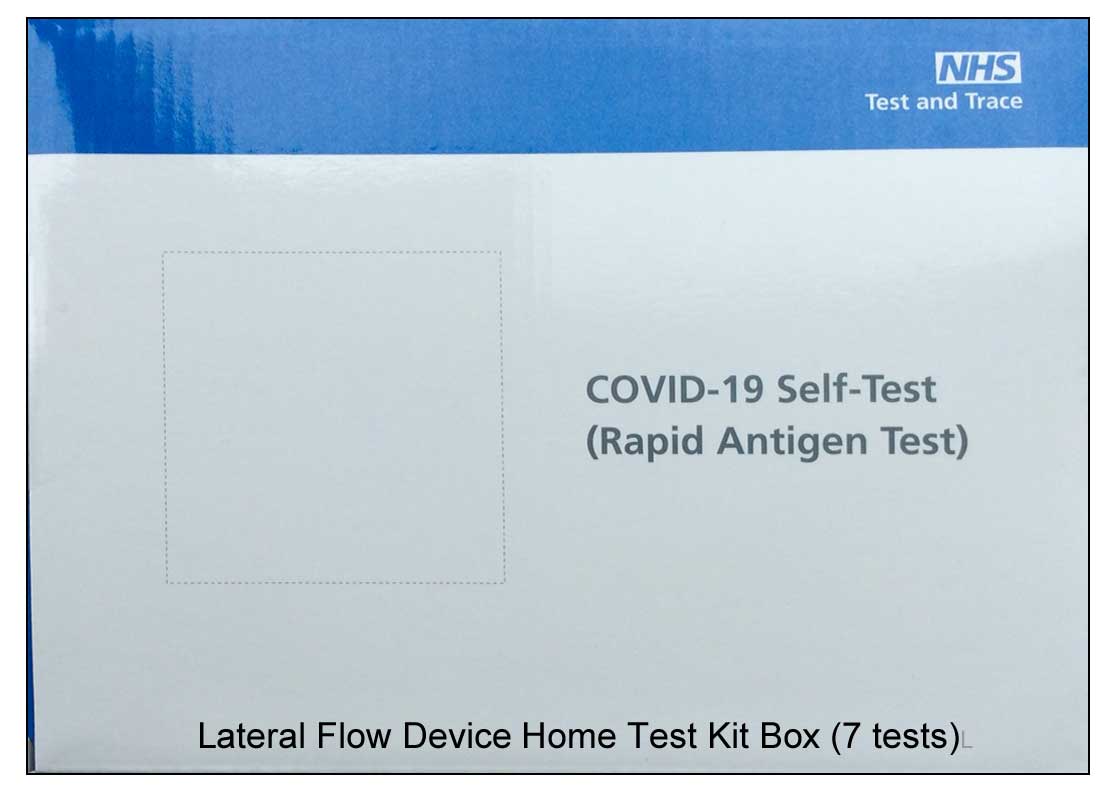
can collect home test kits,
for example packaged as the COVID-19 Self-Test (Rapid Antigen Test) in boxes
of 7 tests, from Malvern library, the Co-op, and most pharmacies such as Boots and Murrays in Church
Street, Claremont House and Lloyds in Barnards Green, Murrays at Prospect
View, Evans and Murrays in Malvern Link, and Boots and Morrisons on the
Enigma Retail Park.
You
can collect home test kits,
for example packaged as the COVID-19 Self-Test (Rapid Antigen Test) in boxes
of 7 tests, from Malvern library, the Co-op, and most pharmacies such as Boots and Murrays in Church
Street, Claremont House and Lloyds in Barnards Green, Murrays at Prospect
View, Evans and Murrays in Malvern Link, and Boots and Morrisons on the
Enigma Retail Park.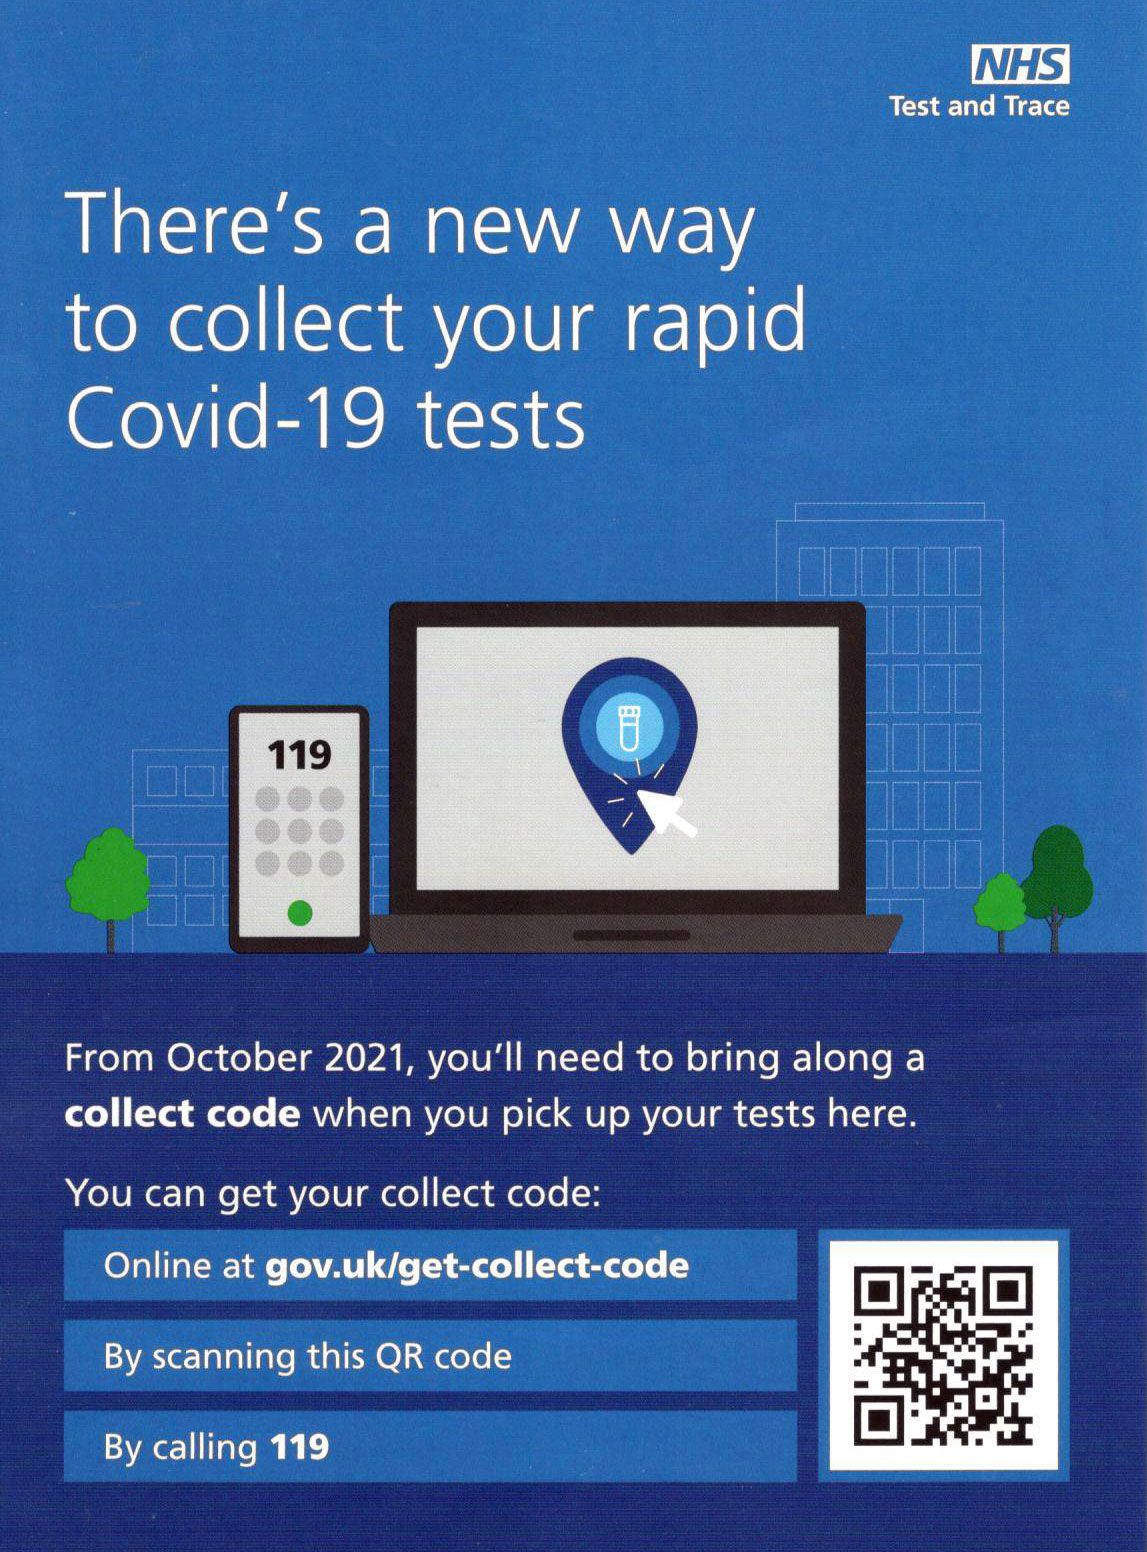
| Country | 12-15 years | 16-17 years |
| England | 27% | 62% |
| Wales | 53% | 78% |
| Scotland | 55% | 76% |
Percentage of children vaccinated as of 5th November
source: Independent SAGE
Let's hope the situation will rapidly improve now parents with cars can get children aged 12 -15 years vaccinated at the Three Counties Showground.
The ONS says about 90% of adults have antibodies either through infection or vaccination but achieving herd immunity is somewhat doubtful as somewhere between 6 and 30% of the double vaccinated can catch the Delta variant of COVID-19; nevertheless vaccination is most important to protect as many people as possible from debilitating long term loss of smell and taste, Long COVID, serious illness, and death.
Click for NHS video warning young people of the dangers of the virus for the unvaccinated.
Vaccination statistics can be found on the Vaccination tab of the Coronavirus Dashboard.
Booster jabs
By now those aged 70+ years should either have received a letter or text message from their GP surgery or a letter from the NHS asking people to book an appointment for their booster. You may have to wait a week or two, but it should not be difficult to get a booster jab in Great Malvern and surrounds.
The number of booster jabs given in England can be found in a spreadsheet on the NHS England website. Look in the data section for the COVID-19 daily announced vaccinations Excel file which gives a breakdown of jabs by region and age.
Click for NHS COVID-19 vaccinations
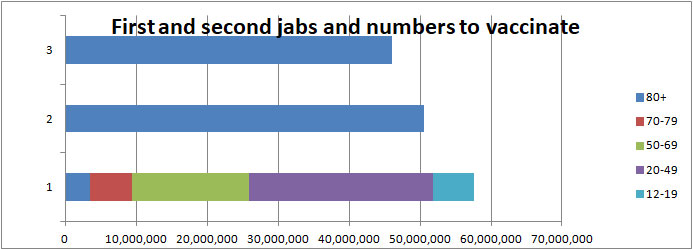
As of 13th November 10,188,021 booster jabs and third doses were said to have been given in England.
The Coronavirus Dashboard reports on 13th November a total of 12,164,586 booster and third jabs had been given in the UK with the daily average being about 300,000 jabs per day which is pretty good bearing in mind many volunteers have been stood down.
There are said to be about 28M who will be due for a booster by the New Year. Assuming 2M jabs per week, we expect all those aged 70+ years will have had their booster shot before Christmas; but the youngest of those aged 50+ might have to wait until towards the end of January.
Vaccinations Worldwide
A chart of the worldwide vaccination situation can be found on the Our World in Data website.
Click for worldwide statistics
Note: click the country list on the left hand side of the screen to add or remove countries from the chart.
The UK did well to start with but has fallen behind many other countries. For example Portugal has fully vaccinated 87% of its population compared to 67% in the UK.
Australia has overtaken the UK with 69% fully vaccinated.
 Number of cases
The steady fall in daily cases over the last three weeks slowed this week with signs of a small upturn in the last few days.
During the last week the average rate of people testing COVID positive in the UK reported by PHE on the 'Coronavirus Dashboard' rose slightly from 35,362 to 37,488 cases per day.
The ZOE COVID Study estimates there are more likely 65,000 cases per day compared to 81,000 last week.
The chart below shows broadly how the daily rate reported by PHE has varied since 1st September.
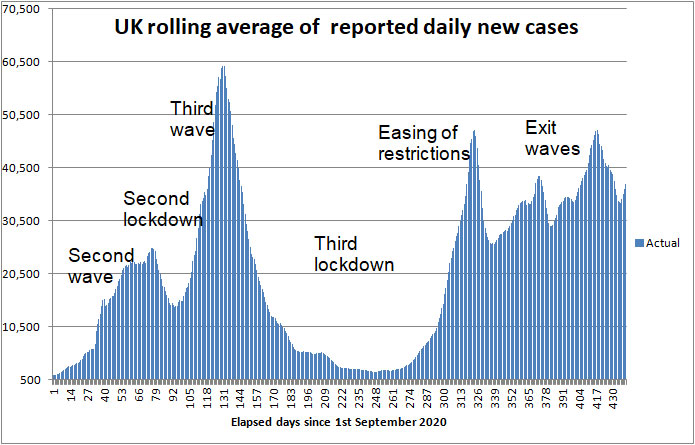
UK daily confirmed COVID cases 1st September 2020 to 14th November 2021
Zooming in, the next chart shows in more detail how daily UK cases have tipped up in the last few days.
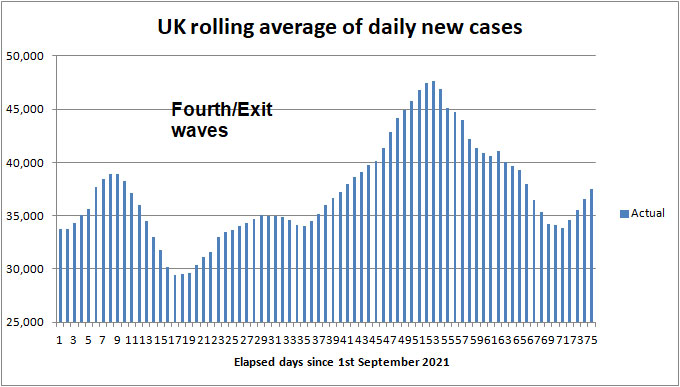
UK daily new confirmed COVID cases 1st August to 14th November 2021
During the last week the cumulative total of confirmed UK COVID-19 cases reported by PHE rose by 259,190 to 9,561,099.
In Worcestershire there have now been 76,072 confirmed cases of COVID-19 an increase of 2,129 on last week.
The next chart shows how daily cases in Worcestershire have fallen in the last few days.
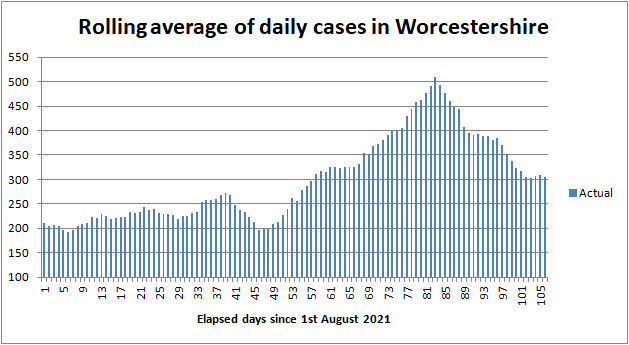
Daily cases in Worcestershire from 1st August to 14th November 2021
The rolling average of daily cases fell slightly from 338 levelling off at 304.
The breakdown by Worcestershire Lower Tier Local Authorities (LTLA) is shown in the following table, together with comparisons for Herefordshire, a more sparsely populated county, and the city of Leicester.
Note: the cumulative cases are copied from the 'Cases by area' (whole pandemic) data set of the Coronavirus Dashboard. The weekly increase is the difference between this week and last week's total.
| Districts of Worcs | Cases | Weekly increase | Population |
| Bromsgrove | 14,997 | +422 | 98,529 |
| Malvern Hills | 7,064 | +255 | 77,545 |
| Redditch | 13,081 | +348 | 85,317 |
| Worcester | 13,054 | +370 | 103,542 |
| Wychavon | 14,725 | +449 | 126,240 |
| Wyre Forest | 13,151 | +285 | 100,957 |
| TOTAL | 76,072 | +2,129 | 592,130 |
| COMPARE WITH | |||
| County of Hereford | 20,303 | +781 | 195,000 |
| Leicester (city of) | 63,922 | +1,310 | 400,000 |
Cumulative cases reported by PHE in Worcestershire to 14th November 2021
Cases are mostly down a bit, except for Redditch and the City of Leicester where cases rose slightly.
Note: the weekly increase is indicative; the seven day average by area, which varies day to day, is an alternative metric that can be found on the Coronavirus dashboard.
Interactive maps
At the bottom of the Coronavirus Dashboard (daily update) page there is an Interactive Map which is coloured to show infection rates across the country.
This week the map has changed from mostly purple to mostly blue suggesting cases have diminished across England, including the Malvern Hills..
Click for Interactive Map of COVID cases
Note: the Interactive Map works on desktop PCs but it's possible you may encounter difficulties using a tablet or smartphone.
Recent weekly cases to 8th November are: North Malvern 32; Malvern Link 15; Pickersleigh 16; Barnards Green 9; Malvern Wells and Priory 10; Callow End and Hanley 23; Upton and Welland 24.
Another map can be found on the Zoe COVID Study website indicating extrapolated cases based on reports from those using the Zoe app.
Click for People with COVID (estimated from the Zoe app)
Number of deaths
Statistics on COVID deaths are published by Public Health England, The Office of National Statistics, and NHS England.
PHE figures
Public Health England reports that the cumulative total of COVID (28) deaths in UK hospitals and care homes rose by 1,093 in the last week to 142,898 while the daily average fell slightly from 170 to 156 deaths per day.
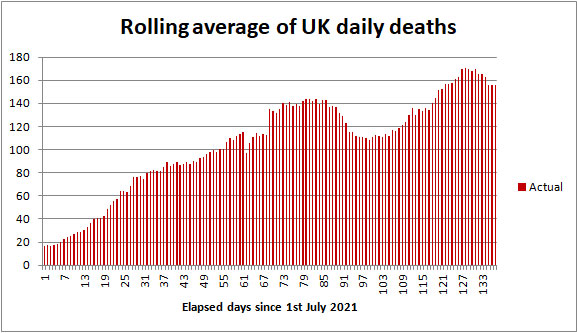
COVID-19 death rate 1st July to 14th November 2021
Click to view the UK government Coronavirus Dashboard
Since England emerged from lockdown on 19th July about 14,000 people have died of COVID-19; mostly the elderly.
In comparison averaged over recent years 1,700 people die daily from all causes, so COVID deaths now make up 9%.
ONS figures
The Office of National Statistics (ONS) separately reports registered deaths in England and Wales where COVID-19 is mentioned on the death certificate. The ONS figures lag the PHE figures by 10 - 14 days and do not include Northern Ireland and Scotland.
Click for national ONS data on deaths (Excel spreadsheet)
The ONS figures are broken down by District providing a glimpse of where deaths are occurring. The provisional cumulative total of COVID related deaths in Worcestershire reported by the ONS up to 29th October 2021 (week 43 of 2021) is shown below.
Note: the numbers are from the ONS Death Registrations-Pivot table
| Districts of Worcs | Deaths 2020 |
Deaths 2021 |
Week 43 | Population |
| Bromsgrove | 164 | 120 | 3 | 98,529 |
| Malvern Hills | 61 | 90 | 0 | 77,545 |
| Redditch | 108 | 96 | 0 | 85,317 |
| Worcester | 87 | 126 | 0 | 103,542 |
| Wychavon | 157 | 141 | 4 | 126,240 |
| Wyre Forest | 171 | 123 | 0 | 100,957 |
| TOTAL | 748 | 696 | 7 | 592,130 |
Provisional cumulative COVID-19 deaths registered by ONS to 29th October 2021
In week 43 there was 1 death in a care home plus 1 death at home and 1 death in hospital in Bromsgrove; and 4 deaths in hospital in Wychavon.
In England and Wales 858 COVID-19 related deaths were reported in the week to 29th October, 69 more than the week before. Of these 85 were in a care home, 65 at home, 9 in a hospice, 692 in hospital and 7 elsewhere.
Note: summation of rows 9 to 339 of the ONS deaths Registrations-Pivot table.
The provisional UK COVID-19 death toll (as reported by PHE and ONS) for all weeks of the epidemic can be found on the Deaths tab of the Coronavirus Dashboard.
NHS England figures for Worcestershire
The table below shows latest COVID deaths in Worcestershire hospitals reported by NHS England on 12th November 2021.
| Worcestershire | Cumulative deaths | Past week |
| Acute hospitals | 875 | 2 |
| Care hospitals | 64 | 0 |
| TOTAL | 939 | 2 |
Click for NHS COVID-19 total announced deaths
More recently, on 13th November, the Coronavirus Dashboard reported 3 deaths in the Malvern Hills in the last 7 days, one of whom is rumoured to have been a 69 year old unvaccinated male.
Click for Summary of Malvern numbers on the Coronavirus dashboard
Risk of COVID-19 death by age band
NHS England provides an analysis of COVID-19 deaths in hospital in England and Wales by age band. Shown below is a breakdown of deaths for the period 1st August 2021 to 20th October 2021 when, despite much of the population being protected by the vaccines, particularly the elderly, the death rate rose to about 130 deaths per day.
| Age band | Number of deaths | % of deaths |
| 0 - 19 | 17 | 0.3 |
| 20 - 39 | 116 | 2 |
| 40 - 59 | 708 | 12 |
| 60 - 79 | 2,470 | 42 |
| 80+ | 2,565 | 43 |
Relative risk of COVID-19 death by age band
Those aged 60+ years continue to account for about 85% of deaths, not far from the figure of 92% last year, but remember that due to vaccination the death rate as a proportion of new cases is five to ten times lower than in 2020.
The majority of these deaths are likely to be of the vaccine-hesitant, those with underlying conditions such as Diabetes, the frail, and those that are immuno-compromised. Pregnant mothers, the overweight and deprived individuals with a poor diet are also said to be at increased risk.
An NHS leaflet offered to patients being admitted to hospital suggests we are at higher risk of complications from COVID-19 infection if we have one or more of the following conditions:
-
Age over 70 or Male over 50;
-
Lung problems (including asthma, COPD, emphysema, bronchitis, bronchiectasis;
-
Heart disease
-
Diabetes
-
Chronic kidney disease
-
Liver disease (eg hepatitis, cirrhosis)
-
Brain or nerve problems (eg Parkinson's disease, motor neurone disease, multiple sclerosis, cerebral palsy)
-
You have a condition that increases the risk of infection
-
Take medication that affects the immune system, (eg steroids)
-
Very obese (BMI over 40)
-
Pregnancy
Many COVID deaths are now rumoured to be of the fully vaccinated elderly, but remember that broadly speaking we are ten times more likely to die of something else, so don't be over-concerned.
Healthcare numbers
The UK government Coronavirus Dashboard includes important information about healthcare statistics.
| Hospital COVID cases (UK) | Number | Change since last week |
| Patients currently in hospital | 8,652 | -508 |
| Patients on ventilation | 999 | -35 |
| Patients admitted daily | 968 | -87 |
Headline summary of patients in hospital reported on 14th November 2021
The number of hospital beds occupied by COVID patients is about 22% of the peak last January.
 Worcestershire hospital beds
Despite hospital bed occupancy remaining fairly flat nationally, COVID bed occupancy has gone up significantly in Worcestershire during the last three weeks.
Tabulated figures for bed occupancy in Worcestershire Acute and Care hospitals can be found on the NHS England website.
Click for NHS England COVID-19 Hospital bed Activity
A summary can be found on the UK government Coronavirus Dashboard which reports on 9th November there were 64 COVID-19 patients occupying Worcestershire Acute Hospital beds, of which 5 were ventilated beds; roughly 24% of the peak experienced last January.
61 patients have been admitted to hospital with coronavirus in the last 7 days.
Note: Healthcare statistics can be found on the Healthcare tab of the UK Coronavirus Dashboard. At the top of the page where it says Healthcare in United Kingdom, click the drop down arrow to select Area Type as NHS Trusts, and Area Name as Worcester Acute Hospitals.
Click to view Worcester healthcare figures
Alternatively,
Click for Summary of Malvern numbers on the Coronavirus dashboard
Forecast for the week ahead
Trends suggest that during the next seven days (up to 21st November) the cumulative total of UK COVID-19 cases reported by PHE on the Coronavirus Dashboard could increase by 260,000 towards 9,825,000 with the 7 day rolling average of daily new cases hovering around 37,000.
In Worcestershire up to 2,200 new cases of COVID-19 can be expected, and 250 cases in the Malvern Hills district.
We estimate the number of UK COVID (28) deaths will increase by about 1,000 towards 144,000 during the 7 days ending 21st November 2021, with the average daily death rate falling to about 145 deaths per day. The daily death rate will probably remain around 140 into early December. These are 'baked in' deaths of those already infected which cannot be avoided.
In the county of Worcestershire, assuming a 0.2% death rate, the 2,129 new cases this week may translate to 4 COVID deaths per week by the first week in December.
We imagine the daily number of patients admitted to hospital will reach 1,000 next week tracking daily cases.
Longer term outlook
We must all be hoping to see a significant downturn in daily hospital admissions and deaths as those aged 50+ years receive booster jabs, and schoolchildren are either vaccinated or gain immunity following infection by COVID-19.
The timing of this is uncertain and will depend on the speed of vaccine rollout; tag on a week or so for the vaccine to take effect, a further week for the increased resistance to infection to impact hospital admissions, and a further two weeks for this to be reflected in the number of daily deaths, then it could be another 4 to 6 weeks before a marked improvement in the figures is seen.
Many commentators had been hoping the epidemic would be 'all but over' by Christmas, but some are now wondering if the tail could extend a further two to three months.
Updated modelling from University College London now suggests the seven day average of daily deaths will remain at about 150 per day for the next two weeks and then decline slowly, reaching a minimum of about 25 per day in the New Year (a month later than originally predicted).
Click for UCL Long-term forecasting of the COVID-19 epidemic
SPIM models do not rule out a further wave of the epidemic next March as the effectiveness of the vaccines wanes and the behaviour of the public returns to 'normal'.
For a fixed level of vaccination, daily cases are a signpost to whether daily hospital admissions and deaths are going to go up or down. Based on our heuristic 'rules of thumb' - recent hospital admissions, cases of Long COVID and deaths were expected to follow daily cases roughly in the ratio:
-
Hospital admissions 1:35 of daily cases reported by PHE, lagging by 8 days.
-
Long COVID 1:35 of daily cases reported by PHE.
-
Deaths 1:350 of daily cases reported by PHE, lagging by about 20 days.
-
UK Hospital bed occupancy - one quarter of daily cases, lagging by up to a month.
While a significant proportion of cases involve schoolchildren, most of whom should not fall seriously ill, these ratios were expected to over-estimate admissions and deaths.
However contrary to expectations daily deaths seem to have worsened to 1:250 of daily cases notified by PHE.
Three factors may be contributing to this:
-
the virus is weeding out the unvaccinated who are becoming increasingly complacent and no longer wearing masks and distancing;
-
a greater proportion of people are not bothering to record their positive Lateral Flow tests, so cases are under reported;
-
the protection offered by the vaccines is waning;
the latter being a good reason to get your booster jab now.
Friends report side effects ranging from a sore arm to feeling groggy for a day or two, so be prepared for this.
Advice for Seniors
 Recently
there have been no more than 8 COVID related deaths per week in Worcestershire
which has a population of 600,000 so we judge the
risk of death for fully vaccinated
Seniors to be
fairly
LOW while the risk of Long COVID might be MODERATE;
see our annex and riskometer opposite.
Recently
there have been no more than 8 COVID related deaths per week in Worcestershire
which has a population of 600,000 so we judge the
risk of death for fully vaccinated
Seniors to be
fairly
LOW while the risk of Long COVID might be MODERATE;
see our annex and riskometer opposite.
Remember, if you are elderly, have not been vaccinated, and were to catch COVID there is a significant chance that you will either die or your long term health may be seriously damaged, so if you are able get both doses of your vaccine and your booster and continue to take care of yourself and those you love. Also encourage others to be vaccinated.
Click for our risk of death table (for those who have not been vaccinated)
Like Health Minister Sajid Javid and Sir Kier Starmer, it is quite possible, despite a second jab, for Seniors to become ill with COVID-19; some might have mild symptoms like a common cold or hay fever, while others could feel very poorly, but few except the frail, vulnerable, and unlucky will need to be admitted to hospital.
Until daily cases fall markedly the simple safeguards to remember are to:
-
get your booster vaccine six months after your second jab;
-
wash your HANDS thoroughly, using soap and hot water, for 20 seconds, including after handling deliveries to your home, to kill virus picked up from contaminated surfaces see note 1;
-
wear a FACE covering when unavoidably near other people for example when shopping, visiting hospital or the chemist, and using public transport;
-
SPACE at least 2 metres from people you don't feel safe with see note 2;
-
preferably socialise with friends and other households outdoors in the FRESH AIR else, if you are indoors, ventilate by keeping doors and windows open as far as is practicable;
-
avoid crowded indoor settings and minimise TIME near strangers;
-
self-isolate and take a test if you feel unwell with cold or flu like symptoms; according to the Zoe COVID Study the top five symptoms amongst the fully vaccinated and children, in order of prevalence, are said to be headache (73%), runny nose (73%), sneezing (59%), sore throat (53%), and cough (49%), which are often hard to distinguish from a common cold;
-
respect others and give them space.
Notes:
1) Wash your hands thoroughly before touching your face to avoid transferring virus from contaminated surfaces to your mouth, eyes and nose. If outdoors use an alcohol based hand gel.
2) Two metres is further than you think - roughly an arm and a walking stick away.
Annex to 14th November update
Commentary
Not much to report this week when the media was mainly reporting on the Climate Conference.
On Monday 8th November the USA opened to fully vaccinated travellers.
Gloucester and Cheltenham hospitals reported a surge in COVID cases.
On Tuesday it was announced NHS workers would have to be fully vaccinated against COVID by next Spring.
Also reports some individuals might have resistance to COVID from T Cells triggered by other viruses; possibly an area for future research.
On Friday the deadline was reached for Care Home workers to be either fully vaccinated or face dismissal.
COVID video updates
The usual charts showing vaccination take-up and COVID cases over time by age band can be found in the Zoe COVID Study weekly update. The Independent SAGE update looks at 'behaviour' this week, while Dr John Campbell looks at the worldwide picture.
Click to watch Tim Spector's Zoe COVID Study 12th November video update
The Independent SAGE weekly briefing is about how behaviour can influence the remainder of the epidemic followed by a short question/answer session. It's worth watching.
Click to watch Independent SAGE 12th November video briefing
Click for Independent SAGE paper - Using behavioural science to help minimise the spread of Covid-19
Click to read more about Independent SAGE on Twitter
Dr John Campbell reviews the COVID figures worldwide
Click to watch Dr John Campbell's 13th November video
U3A
Malvern U3A groups have resumed. Some groups are continuing to meet using Zoom while others are meeting in person.
Members are being asked not to attend meetings if feeling unwell. Names will be taken at meetings and could be passed to NHS Test and Trace if a member subsequently tests COVID positive. Refreshments are being provided by some groups but not others.
Overseas travel
From 24th October travellers arriving from abroad need only take a Lateral Flow Test.
You can now travel to the USA.
List of vaccines (unchanged)
Here is the updated list of COVID-19 vaccines ordered by the UK. It looks as though the government has settled on Pfizer as first choice with Moderna second and Astrazeneca now held in reserve.
Valneva has been cancelled, and approval has not yet been sought for using Novavax in the EU and US although approval has been sought for use in third world countries.
For two doses plus boosters, only about 200M doses will be needed for the population of the UK, so it's possible the government will cancel orders for those vaccines marked in red which have been slow to come to market.
| COVID-19 vaccine | Doses ordered (million) | Status |
| Pfizer BioNTech, two dose, -70 deg C | 40+60+35 | Approved, deliveries continuing, made in Belgium (EU). An additional 60M doses have been ordered for booster shots for the most vulnerable in the autumn. A further 35M doses were ordered in August 2021 for delivery in 2022. |
| Astrazeneca, two dose, fridge | 100 | Approved for those aged 30+ years; deliveries continuing. Batches made in UK, Belgium and India. |
| Moderna, two dose, -20 deg C | 7+10 | Approved. First deliveries to Wales and Scotland 7th April 2021 then England 13th April; mainly for those aged under 50 years awaiting vaccination. |
| Valneva, two dose | 60+40 order cancelled |
A jab from French company Valneva will be made in Livingston, West Lothian, Scotland. Order cancelled September 2021. Delivery had been expected to start in second half of 2021. |
| Janssen, single dose | 20 | Approved, a jab from Belgian firm Janssen, owned by Johnson and Johnson; UK approval 28th May. Order reduced from 30 to 20M. |
| Novavax | 60 ? | A jab manufactured by US firm Novavax being made in Stockton-on-Tees UK; phase III trials complete, but approval has not yet been sought in EU and US. Glaxo Smith Kline (GSK) contracted to fill and package vials. |
| GSK Sanofi | 60 ? | Some delay due to adjusting the formula to give better protection to the elderly; possible approval 2022. |
| Curevac | 50 ? | Contract placed with German company Feb 2021. Possible source of new variant vaccine, but disappointing trial results. Future uncertain. |
Table of vaccines ordered by the UK government
Present rate of new cases and risk
The average rate of infection per 100,000 population per week in England has fallen to 342 while in comparison the figure for Worcestershire is 362 and the Malvern Hills 351.
In Wales the case rate has fallen slightly to 479, whereas in Scotland the rate is 370.
England without restrictions is now doing slightly better than Wales and Scotland with restrictions.
As a yardstick we suggest a figure of below 10 can be considered LOW, so there is a long way to go.
The probability of fully vaccinated Seniors, without underlying conditions, catching and dying from COVID-19 is now possibly somewhere in the range 1 in 1,000 to 1 in 10,000 per year so we judge the risk fairly LOW compared to the risk of dying from other causes. Perhaps as many as 3% to 5% of people who catch COVID suffer from Long COVID so that risk might be assessed MODERATE.
The risk of death from Coronavirus for unvaccinated children and healthy teenagers is said to be small so for them the risk is LOW.
About the UK COVID-19 final death toll
The UK is probably going to have to live with COVID-19 and a background level of infection which may increase every winter as more time is spent indoors. Barring new variants, this could result in many thousands of COVID deaths per year, as with flu. So in that respect there can be no 'final' death toll.
The present 2020/2021 death toll will likely climb from 143,000 towards 150,000 by Christmas 2021 based on the PHE definition of deaths. If ONS figures are used the UK toll could be heading towards 205,000 or perhaps even a tad higher.
Worldwide, this pandemic is not played out and it could be a further 2 to 3 years before the 'dust' finally settles and third world countries are vaccinated. The PM has promised an independent inquiry in Spring 2022 to learn lessons for the future.
At the start of the epidemic on 17th March 2020 the Chief Scientific Adviser, Sir Patrick Valance, questioned by the Health Select Committee, did not disagree with Jeremy Hunt's suggestion that a death toll of 20,000 might be a reasonable outcome.
On the other hand, Professor Neil Ferguson of Imperial College warned in some scenarios the death toll might be as high as 250,000; while we thought, in the very worst case assuming up to 1% of the UK population died the outcome might have been nearer 400,000 taking into account some build up of herd immunity.
So how well will the UK have done? When Jeremy Hunt and Sir Patrick Valance spoke there had been few deaths and they clearly underestimated what was to come. Professor Neil Ferguson was nearest the mark. A few might consider an outcome of about 145,000 deaths during 2020 and 2021 a fair result compared to a greater number of people dying in a very short space of time, more being permanently disabled by Long COVID, temporary collapse of the NHS and patients dying at home or queued in ambulances outside hospitals. You have only to look at the recent situation in India to imagine what could have happened.
Members of the Labour Party and others will no doubt say the UK has done poorly compared to the best performing countries such as New Zealand and Singapore where deaths have been much lower, not to mention the enormous expense of supporting those out of work and huge damage to the economy.
With hindsight, deaths might have been much lower if the second lockdown had been continued into December and January, but that would have meant cancelling Christmas, and who knows to what extent the public would have complied.
A member of the marketing team at US company 'My Bio Source' sent us a link to a History of Pandemics. Let's hope our brilliant scientists can continue to protect us from future threats.
Summary of Links
Symptoms
Article about the effects of Coronavirus on the human body
Reporting and how to obtain a test
How to get a test
https://www.nhs.uk/coronavirus
About joining the Zoe COVID Symptom Study:
Guidance
UK government Coronavirus guidance
COVID-19 Response: Autumn and Winter Plan 2021 for England
COVID Alert states
Guidance on UK COVID-19 alert level methodology: an overview
COVID-19 Alert Level lowered to 3 on 10th May 2021
Tiers
Guidance on tiers: what you need to know
Government postcode checker to find tier for other areas
Statistics
UK government Coronavirus Dashboard
Coronavirus Dashboard Interactive Map
ONS data on deaths in England and Wales (Excel spreadsheet)
NHS England COVID-19 Daily Deaths
NHS England COVID-19 Hospital Admissions
NHS England vaccination statistics
Worcestershire Coronavirus Dashboard
Worcestershire COVID-19 Vaccinations Dashboard
HSA COVID-19 vaccine weekly surveillance reports
A glimpse of the worldwide vaccination situation can be found on the Our World in Data website.
Click for chart showing % vaccinated
Modelling
A forecast of the progression of the COVID-19 epidemic can be found on a University College London (UCL) website.
Click for UCL Long-term forecasting of the COVID-19 epidemic
A projection of the future COVID-19 death toll and daily deaths can be found on The Institute for Health Metrics and Evaluation website.
Click for IHME projection of COVID-19 deaths
Reports
ONS Coronavirus (COVID-19) Roundup
The bigger picture
Worldometer summary of coronavirus cases worldwide
European Centre for Disease Prevention and Control info
https://www.ecdc.europa.eu/en/geographical-distribution-2019-ncov-cases
World Health Organisation info
Window on the USA
Centre for Disease Control (CDC)
American Association of Retired People (AARP)
Worcestershire
Help:
http://www.worcestershire.gov.uk/here2help
Worcestershire County Council COVID-19 information:
http://www.worcestershire.gov.uk/coronavirus
Here you will find a useful link,
'Website: Number of new cases by date in Worcestershire'
which displays interesting COVID charts and statistics for Worcestershire
Miscellaneous
Spanish Flu
Dr Jeff Kildea's commentary about the 1919 outbreak of Spanish Flu in Australia
Views of Martin McKee, Professor of European Public Health
Follow Martin McKee on Twitter
SAGE membership
Scientific Advisory Group for Emergencies (SAGE)
Scottish government:
Link to Scottish Government website
Link to Postcode checker for COVID restrictions by protection level in areas of Scotland
Welsh Government:
Guidance on COVID alert levels in Wales
![]()
The interpretations and opinions expressed are our own
Last updated 14th November 2021